Although the basics of changing the electrical length of an antenna wire by adding a reactive load to it are seemingly well-known, the precise relationship between real loads provided to real antennas and modeled loads provided to modeled antennas is not so certain as one might think. Therefore, this series of notes will try to look at some of the ins and outs of the matter--all without pretending either to authoritativeness or completeness. It will be enough if we can get a better handhold on the subject.
For antennas up to (but not including) 1/2 wl long, the source impedance is capacitive. To bring the antenna to resonance, we electrically lengthen it by adding an inductive reactance. We can add the reactance at the element center, or we may split the load into two equal parts and place them farther out on the element. The require inductive reactance needed to bring an element to resonance increases the farther out along the element we place the reactances.
Since every method of implementing an inductive reactance has some resistive loss, the reactive device has a Q, a ratio of inductive reactance to resistance. The higher the Q, the lower the losses. The most common two means of providing an antenna in the HF region with an inductive reactance are the air-wound solenoid inductor and the shorted transmission line stub less than 1/4 wl long. Both are physical entities having both basic and functional loss mechanisms. For example, solenoid wire for any given RF frequency has an AC resistance that is a function of skin effect. In addition, the interaction of the individual turns of the coil may yield other losses. Whatever the source of the loss, the solenoids Q or figure of merit expresses them all within the resistive denominator of the ratio.
NEC (either -2 or -4) provides several means of modeling inductively reactive loads. The most common type is the following:
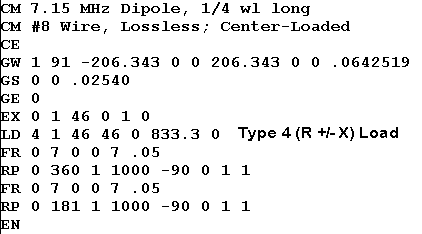
Type 4: Complex loads consisting of a resistance and a reactance. This is the native type of load for NEC. All loads are eventually translated into values of resistance and reactance. However, this type of load remains constant. That is to say, for the frequency sweep specified in the simple model in the figure, the values of resistance and of reactance remain the same for each frequency checked.
Type 4 loads are therefore not useful for frequency sweeps, since real solenoid components do not have the same reactance on every frequency. Reactance changes with frequency in relationship to a solenoid inductance. For most purposes in antenna work, the inductance and the resistance of the coil are treated as constants in simple inductive reactance loading problems.
Type 4 loads, however, are especially useful for initial design work. For example, if one has a short center-fed antenna, the reactive component of the source impedance will specify the absolute value of center reactive load necessary to eliminate it. The type of reactance introduced will, of course, be the opposite of the reactive component of the source impedance. since antenna wires shorter than 1/2 wl show a capacitive reactance at the source, a center reactive load must be inductive.
Type 4 loads are also very useful for setting up or exploring the effects of the load Q on antenna performance. The results will apply only at the frequency for which the values hold good. However, one can easily obtain a family of value curves for comparing various antenna parameters.
Let's set up a test dipole to see the type 4 load at work.
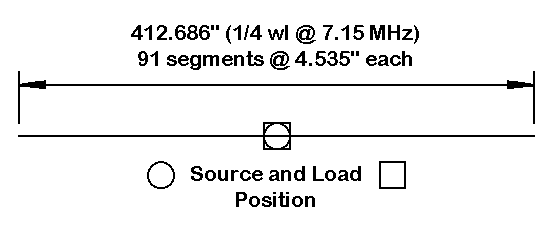
The test dipole is exactly 1/4 wl long at 7.15 MHz, which makes it far short of resonant. We shall introduce a reactive load at the center, in the same position as the source or feedpoint. In NEC models, the source and the load are in series when the modeler specified the same position or segment for both the source and the load. The effect is comparable to splitting the center-loading solenoid at the center to insert the source (normally a transmission line for operational amateur radio stations).
The test model antenna uses lossless or perfect wire so that the only losses that appear will be from the load or loads we add. It uses 91 segments for reasons that will appear in later episodes. If this little test is replicated, be sure to use the same number of segments as in the example to obtain the same results. Antenna resonance in the modeling exercise is defined as a source impedance of less than +/-1.0 Ohm, and in most cases, the reactance will be less than +/-0.1 Ohm. Since there will be a slight drift in the source impedance as the segmentation of a given wire is changed, even for well-converged models, replication of results requires detailed replication of all of the model parameters.
We may determine the required load for the antenna simply by reading the source impedance before inserting a load. We shall use two diameters of wires for this example: #8 and #12 AWG (with diameters of 0.1285" and 0.0808", respectively). To cancel out the capacitive reactance, the #8 antenna requires a center inductive reactance of 833.3 Ohms, while the #12 wire antenna of identical length requires 889.4 Ohms. For any value of Q, the resistance is simply the reactance divided by the selected Q value. Thus, we can select a range of Q-values to check. In this case, let us check a perfect inductively reactive load (R = 0), along with finite Q-values of 1000, 750, 500, 250, and 100. For the two antennas--which differ only in wire diameter--we get two families of values, which the following graph artificially connects with an identifying line just to keep the two antennas differentiated from each other.
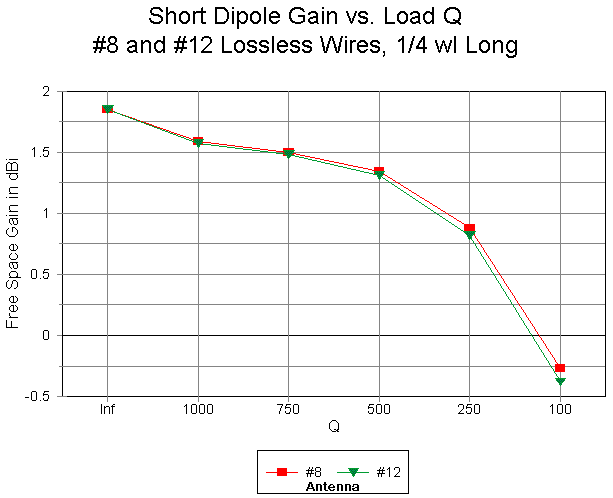
First, let's remember that the two antennas required two different reactive load values solely as a function of the source impedance. Both antennas use lossless wire, so the source impedance difference is a function of wire diameter. Now, if we look at the left-most line, where Q is infinite because the load resistance is zero, the antenna gain is the same for both wires. The fact that the value (1.85 dBi) is less than the traditional values for a resonant dipole (2.14-2.15 dBi) results from the length of the wire. It is much shorter than a resonant dipole. The wire shows the same gain without a load in place. Part of the gain of an antenna is a direct function of its length. In fact, you wish to obtain more gain from a dipole, make it longer--up to about 1.25 wl long. You may not like the resulting source impedance, but the antenna will have more gain simply by being longer--until it reaches a length where the pattern begins to degenerate into multiple lobes.
Second, the divisions from left to right following no special pattern. Hence, the actual curve of the values is not apparent. The drop in gain from a perfect load to one with a high Q-value of 1000 is noticeable. The region between a Q of 1000 and a Q of 500 strongly suggests that the curve of gain does not track arithmetically. Indeed, the curve is much straighter if each selected Q-value is of a constant ratio with the immediately preceding value throughout the chart.
Third, the two families of values track each other, with lower gain values for the #12 wire antenna. If we remember that the necessary inductive reactance for the #12 wire antenna was higher than for the #8 antenna, then it follows that for any given Q, the resistance will also be higher. The higher the resistance of a center load, the lower the gain.
The type 4 load from which we derived the modeled data is a mathematical entity only. Whereas the wire is modeled as a physical entity, the load is only a mathematical modification of the results. Hence, any physical properties that the load may have will not play a role in its modeled performance. The length and diameter of the loading mechanism are never modeled in Type 4 loads, even if in reality they may play some kind of role in the performance of the antenna.
Equally mathematical are loads of the following type:
Type 0: Loads consisting of the following is series: resistance, inductance, and capacitance. Missing elements are entered as values of zero (which the program automatically interprets as a missing value, not a zero value). to specify an inductor of 6 microH with a series resistance of 2 Ohms, one enters this: 2, 6E-6, 0. The final zero indicates that there is no capacitor.
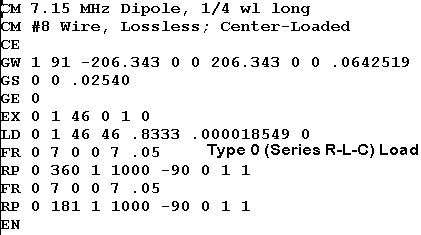
The LD line in the input file shows the load type and values for resistance and inductance, again with a missing capacitor. Another load type (Type 1) is available for parallel combinations of resistance, inductance, and capacitance. We shall not need it for this particular set of notes.
The advantage of using R-L-C loads is that NEC translates them into appropriate values of reactance for each frequency checked in a file request. Hence, with R-L-C loads, one may run a frequency sweep and have the correct reactance at each frequency is the sweep.
However, there is an accompanying limitation. The value of R remains constant. Therefore, the Q of the reactive device changes slightly with each frequency checked, since the ratio of reactance to resistance changes across the range of the frequency sweep. For limited-range frequency sweeps, such as across one of the HF amateur bands, the possible error is too small to be significant.
Of course, one needs to be able to translate reactance to inductance (or, in other cases, capacitance) and back again to set the proper values. If one begins with a value of inductance, one must find the value of reactance for the frequency in question in order to use a value of Q to set the resistance or to find the value of Q from an assigned or measured value of resistance. The standard relationship of reactance to inductance, where inductive reactance is 2 PI times frequency times inductance in basic units, is an essential utility tool for using R-L-C loads.
A set of frequency sweeps between 7.0 and 7.3 MHz in 0.05 MHz steps for the #8 perfect wire dipole, center-loaded at the design frequency of 7.15 MHz for resonance with an inductance of 18.549 microH will yield a family of SWR curves. For each curve, the source impedance against which the antenna impedance is compared is the resistive impedance of the antenna at resonance on the design frequency. Hence, each curve shows a 1:1 VSWR at design center.
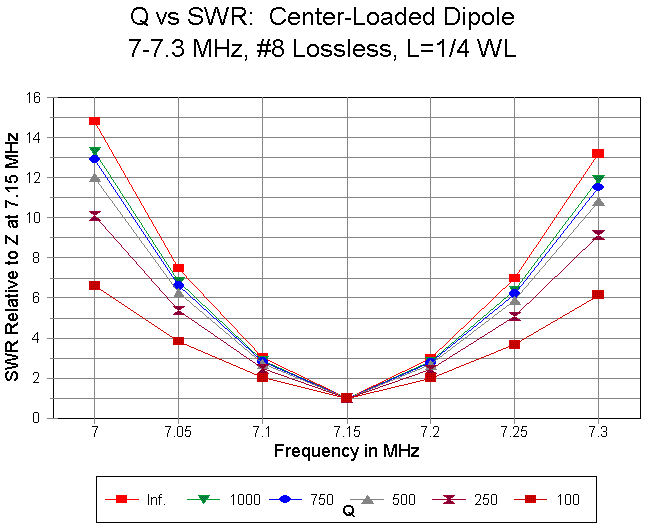
The graph shows a family of such curves for a perfect inductor (zero Ohms resistance) and for inductors with Qs of 1000, 750, 500, 250, and 100. The requisite values of series resistance for the inductor are 0.8333, 1.1111, 1.6666, 3.3332, and 8.333 Ohms from 1000 down to 100. Once more, as we suspected from the gain curves earlier, the results of altering Q are more geometric than arithmetic, varying more linearly as Q forms a constant ratio from one value to the next.
Apparent in the graph is the fact that as we lower the Q of the loading coil, the operating bandwidth--set by any arbitrary selection of a VSWR ratio--become wider in terms of frequency. Often, we simply summarize the effect by saying that the increased losses broaden the operating bandwidth, as if the summary were an explanation. It is not.
In fact, what occurs, as modeled, is interesting in itself--and somewhat obvious if we stop to think about it. Consider the following two tables of values of source impedance for the #8 and the #12 dipoles, each center- loaded. The #12 wire antenna requires a 19.798 microH inductor with suitable adjustments in the values of the series resistor for the Q-values indicated earlier.
#8 Wire Dipole           Source Impedance (R +/- jX Ohms)
Freq.     Q=Inf.         1000           750            500		250            100
7.00      12.58-46.28    13.41-46.29    13.69-46.28    14.24-46.29	15.91-46.29    20.91-46.29
7.05      12.78-30.76    13.61-30.76    13.89-30.76    14.45-30.76	16.11-30.76    21.11-30.76
7.10      12.98-15.30    13.82-15.30    14.09-15.30    14.65-15.30	16.32-15.30    21.32-15.30
7.15      13.19-0.02     14.02-0.02     14.30-0.02     14.86-0.02	16.52-0.02     21.52-0.02
7.20      13.40+15.26    14.23+15.26    14.51+15.26    15.06+15.26	16.73+15.26    21.73+15.25
7.25      13.61+30.25    14.44+30.25    14.72+30.25    15.27+30.25	16.94+30.25    21.94+30.25
7.30      13.82+45.29    14.65+45.29    14.93+45.29    15.49+45.30	17.15+45.29    22.15+45.30
Delta R    1.24          1.24           1.24           1.25		1.24           1.24
Delta X   91.57          91.58          91.57          91.59		91.57          91.59

#12 Wire Dipole          Source Impedance (R +/- jX Ohms)
Freq.     Q=Inf.         1000           750            500		250            100
7.00      12.61-49.30    13.50-49.29    13.79-49.29    14.39-49.29	16.16-49.29    21.51-49.30
7.05      12.81-32.78    13.70-32.78    13.99-32.78    14.59-32.78	16.37-32.78    21.70-32.78
7.10      13.01-16.29    13.90-16.30    14.20-16.30    14.79-16.29	16.57-16.29    21.91-16.29
7.15      13.22-0.00     14.11-0.00     14.40-0.00     15.00-0.00	16.78-0.01     22.11-0.00
7.20      13.43+16.31    14.32+16.31    14.61+16.31    15.21+16.31	16.98+16.31    22.32+16.31
7.25      13.64+32.29    14.53+32.29    14.82+32.29    15.42+32.28	17.19+32.28    22.53+32.28
7.30      13.85+48.35    14.74+48.34    15.04+48.34    15.63+48.34	17.41+48.34    22.74+48.35
Delta R    1.24          1.24           1.25           1.24		1.25           1.24
Delta X   97.65          97.63          97.63          97.63		97.63          97.65
The limits of accuracy are set by the last digit in each number, plus or minus 1, as a function of the sum of rounding conventions within the program. Within those limits, which vary only the value in the hundredths column, for each antenna, the range of variation of both resistance and reactance is invariant, regardless of the value of Q. Since Q is a function of changing R, the values for source reactance do not change at all. The values of source resistance is simply the values at infinite Q plus the series resistance of the inductive load.
In other words, the presence of a center load of finite Q does not alter the VSWR operating bandwidth curve by changing the source impedance other than adding the load resistance to the natural source resistance of the antenna without any load at all.
What the addition of the load series resistance does is to change the ratio of resistance to reactance at any of the frequencies swept, essentially raising the ratio of resistance to reactance. For the test antennas, the amount of change ranges from a fraction of an Ohm to under 10 Ohms. However, in each case, the result is a change in the impedance phase angle toward the resistive and away from the reactive.

The basic SWR equation shows the importance of this simple adjustment in terms of a lowering of the SWR at any frequency within the sweep range, when the value of Zo is the same as the value of Rin at the design center frequency. With values of Xin constant, higher values for Rin and Zo will together lower the VSWR relative to a design center frequency value of 1:1.
Before we turn away from the modeling of center loads with the mathematical models available in NEC, let's look at the alternative method of creating an inductively reactive load: the transmission line stub. These stubs present us with an immediate modeling problem. Modeled transmission lines appear in parallel with sources. So we must move them. Moreover, a single stub would be very long (over 20' long for a 600-Ohm line). Common practice is to split the stub into two equal parts, installing one on either side of the line at the main element feed point. Our simple modeling counterpart would be to place TL entries in NEC on each of the adjoining segments to the source segment.
(Note: Use of transmission-line loads implemented with TL entries is NOT recommended wherever the currents on the two transmission lines are unequal. On some occasions we may not know in advance that the currents are unequal. For this exercise, we are purposely violating the recommendation in order to study the consequences of trying to model load lines using TL entries.)
However, we cannot simply use the value of the center-loading reactance and split it into two pieces. If the reactance is split and moved away from the source point, the sum of the pieces will be greater than the value of the exactly centered single reactance. The center loading reactance required for the #8 perfect wire dipole that is exactly 1/4 wl long overall in free space was 833.3 Ohms. Two reactances placed about 9" apart center- to-center, one on either side of the source, require 426.3 Ohms each (or 852.6 Ohms total)
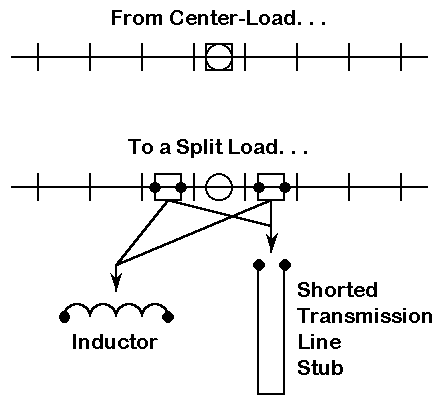
With a type 4 reactive load, we can move in two loading directions. One of them is a Type 0 series R-L-C load, which requires an inductance at 7.15 MHz of 9.4892E-6 H on each side of the source. The other direction is a pair of transmission line stubs each side of center. Since the models of the stubs are mathematical only and a form of a NEC network, they will not show any interaction, loss, or other factors other than reactance.
The reactance of a shorted stub is equal to the characteristic impedance of the transmission line times the tangent of the electrical length of the stub in degrees or radians. Since we know that the stubs will each show 426.3 Ohms reactance, we can work backwards through the relationship to obtain the electrical length for a variety of common lines. Then we can obtain the physical length, since we know that a wavelength at the design frequency is 137.5624' long. For this exercise, we shall look at several common transmission lines with characteristic impedances of 50, 75, 300, 450, and 600 Ohms. We shall let the velocity factor be 1.00, since many of the lines offer options and variability. We have cut off the characteristic impedance at an upper limit of 600 Ohms, since with #8 wire, even 700-Ohm line requires over 22" of spacing without significantly altering the 600-Ohm values across the band.
Let's first determine the VSWR for a pair of perfect solenoid coils and then for lines of 300, 450, and 600 Ohms across the 40 meter band. Each lossless coil will have a 9.4892 microH inductance. The line lengths required by each of the lines (including the ungraphed 50 and 75 Ohm lines) will be as follows:
Line Zo             50        75        300       450       600
L (degrees)         83.31     80.02     54.86     43.45     35.39
L (feet)            31.83     30.58     20.96     16.60     13.52
We create on the segments on each side of the source a TL or transmission line entry. Depending on the program we use, we might have to create a distant wire to terminate the stub or the program might do this for us and simply let us specify that we desire a short at end 2. Do not enter the length in electrical degrees, or a frequency sweep will not be accurate. That same electrical length, with a different physical length, will appear at each frequency checked by the sweep. Instead, enter the design center physical length of the stub, along with the characteristic impedance of the line. We shall explain in a moment why the 50 and 75 Ohm lines are not included in the graph below
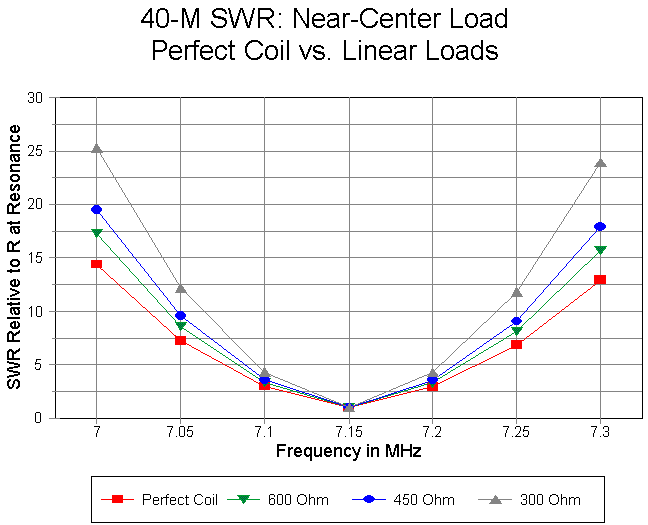
With all practical characteristic impedance lines, the SWR bandwidth is significantly narrower for a transmission line stub load than for a coil of indefinitely high Q. Note that the SWR bandwidth decreases as the characteristic impedance of the line decreases. The low impedance lines were omitted because their end values of SWR exceeded 100 and would have obscured the detail of the graph.
The reason for the narrower bandwidth is not Q as ordinarily understood in terms of resistive losses within the reactive loading device. Neither loading means has any resistive losses in the models. Rather, the stubs have reduced bandwidth because the value of reactance is a tangential function of their electrical length as the frequency changes, which yields a curve quite unlike the curve of solenoid coil reactance vs. frequency. The difference shows up vividly in these examples, since the required reactance is so high. For small-value line-vs-coil applications, such as the values associated with beta matches, the curves across a ham band will not be significantly different if the stub uses a high characteristic impedance.
To reinforce the differences between single-layer solenoids and transmission lines stubs as sources of reactance in antenna loading, let's look at tables of values for the perfect coil and the bank of transmission lines used.
             Source Impedance (R +/- jX Ohms)  (Values rounded)
Frequency      Coil                          Line Zo
MHz                      50         75         300        450        600
7.00      13.1-47.3      13.0-207   13.0-154   13.1-64.8  13.1-56.3  13.1-52.7
7.05      13.3-31.5      13.2-147   13.3-107   13.3-43.3  13.3-37.5  13.3-35.0
7.10      13.5-15.6      13.5-78.5  13.5-55.9  13.5-21.7  13.5-18.7  13.5-17.5
7.15      13.8-0.0       13.8-0.2   13.8-0.1   13.8+0.0   13.9-0.0   13.8+0.0
7.20      14.0+15.7      14.0+91.5  14.0+61.2  14.0+22.0  14.0+18.8  14.0+17.6
7.25      14.2+31.1      14.3+201   14.3+122   14.2+43.9  14.2+37.4  14.2+33.9
7.30      14.4+46.6      14.7+334   14.6+205   14.5+66.1  14.5+56.2  14.4+52.3
The table shows several features of using transmission line stubs as loading elements at or near the center of the antenna element. First, the range of reactance variation is higher in all cases than for the perfect inductor. Second, although the phenomenon is smaller by far, the range of source resistance values is also greater for transmission line stubs than for perfect (and, by reference to earlier data, for finite-Q) inductors.
Since all of the loading devices used here have no resistive losses, their Qs as determined by the usual ratio of reactance to resistance are identical. However, their operating bandwidths are not at all equal due to the manner in which the reactance changes with frequency for the two types of reactive loads. Although there are ways around the problem for special cases, there is no direct way to introduce losses into the transmission line model used by NEC. Hence, one cannot by this means explore the effects of accounting for losses in the stubs.
Despite this shortcoming, TL models of transmission lines stubs do reveal some properties of their use as reactive loads. The fundamental differences in behavior relative to inductors across a band of frequencies should be clear. Second, for single frequency use, stubs are equivalent in all ways to inductors. Finally, we may note in passing that inductively reactive stub loads have an alternative name: linear loads. That name has, unfortunately, led to a number of persistent misunderstandings about their basic nature. We shall have to return to that name later.
However, lest a small matter go unnoticed, let me set it out in relief. In splitting and moving the loading reactance only about 9" each side of the source, we found an increase in the required value of loading reactance. At the same time, the 7.15 MHz resonant source impedance for the antenna increase in the perfect reactance models from 13.19 Ohms to 13.76 Ohms. Although two cases alone do not constitute a trend, I shall bet that one is afoot. And with this, we have a prelude to looking at inductively reactive loads installed at a distance from the centered source of our very short dipole.