Modeling transmission lines between the source and the antenna can take two forms. We can physically model parallel transmission lines. And, as we saw in the last column, we can model them as TL inputs.
Physical Models of Parallel Transmission Lines
Consider a simple antenna fed at the center, as sketched in Fig. 1. The source is in series with the antenna wire. Any transmission line we use to feed the antenna thus forms a series circuit with the antenna wire. At the base of the transmission line, the actual source is now in series with the two wires making up the line.
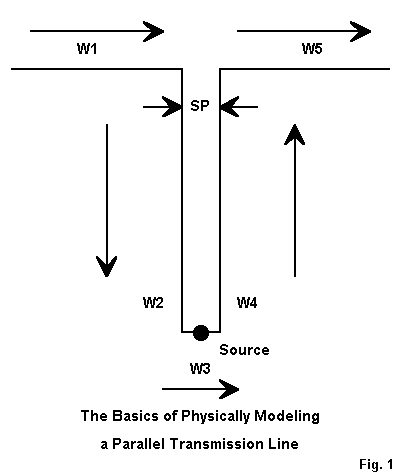
These simple facts determine the basic rules for modeling a parallel transmission line as a parallel set of wires. First, we break the single antenna wire element into two segments, with the centermost ends spaced the same distance apart as the spacing of the wires in the transmission line.
In the figure are a set of arrows indicating ends 1 and 2 of each wire, using a left-to-right convention for this example. Note that we keep the series of wires continuous so that End 2 of Wire 1 connects to End 1 of Wire 2. The model progresses continuously from one end to the other. This is crucial to ensure that the transmission line has equal and opposite currents at every point. (For many placements of transmission lines, the "equal and opposite currents" situation will not fully materialize in reality. However, we should always model the transmission line in the manner shown.)
The source wire may simply be a one-segment wire from one side of the transmission line to the other. This wire will only be as long as the spacing between transmission line wires, and its segment length sets some specifications for the transmission line segmentation.
Segments that meet at angular junctions should be about the same length and in any event within about a 2:1 length ratio. Closely spaced transmission lines require much shorter segments due to the close spacing of their wires. The similar junction at the top of the assembly, where transmission lines wires and antenna wires meet, dictates short antenna wire segment lengths. Even for simple antennas, the entire assembly can quickly grow past the overall segment limit (usually about 500) for modestly priced commercial NEC packages.
One possible solution is to taper the segments lengths along the transmission line, especially at the end closest to the source. EZNEC provides for element length tapering. However, the shortest segment length selected should not be the standard value (0.0025 wavelength), but should match the element spacing. However, NEC-2 recommends that no segment be shorter than 0.001 wavelength long, which the spacing of a 300-ohm line will violate at many HF frequencies. Errors for lines in the 450-ohm to 600-ohm range run about 5 ohms difference from full segmentation (at the test frequency of 14.15 MHz), but length-tapered transmission line models may save from 30 to 130 segments per 1/4 wavelength of each side of the transmission line.
Physical transmission lines are usually calculated according to one of two equations:

where Zo is the characteristic impedance of the resulting air-insulated parallel feedline, S is the center-to-center wire spacing, and d is the wire diameter in the same units as S. The first form is handiest for calculators, while the second form is somewhat more accurate for closely spaced lines.
Program suites such as HAMCALC have modules for calculating the Zo from the wire size and spacing of air-insulated lines--or for calculating any third factor from the other two. Note that these equations do not account for insulation other than air, and the velocity factor is either 1.0 or very close to it. Therefore, any models of physical transmission lines should be based on a velocity factor of 1.0 and the results later readjusted for the actual velocity factor of the line used. Likewise, any losses due to the dielectric must also be accounted for after modeling.
Interestingly, an extensive series of models using NEC-4 reveals that transmission lines between 300 and 600 ohms show a higher impedance than that calculated for them with the equations. Fig. 2 shows the test modeling arrangement. Instead of an antenna structure at the top of the transmission line, the lines were bridged with a resistive load.
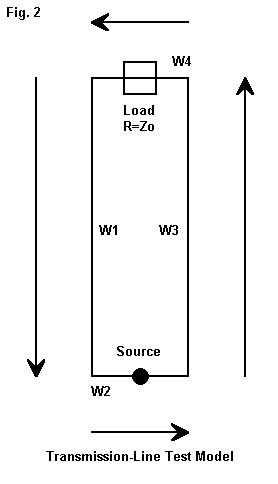
The following table shows the results of using the arrangement with a carefully adjusted 1/4 wavelength line of #14 AWG copper wire at 14.15 MHz (210"). Theoretically, the source impedance should be the same as the load resistance only when both are equal to the line impedance, according to the standard 1/4 wavelength line equation:

where Zo is the characteristic impedance of the line, Rl is the load resistance, and Zs is the reported source impedance, all in Ohms.
First, there is a small and uneliminable reactance at the source from the test model. Second, the wires are very close together, approaching the limits of NEC-4 to handle, even when segments are carefully paralleled. In all cases, the modeled impedance is higher than the calculated impedance by from 5% to 7%.
Line Zo        Wire      Spacing   Modeled Zo     New Wire
Calculated     Dia.      (inches)  in Ohms        Size for Zo
600            0.064"    4.78"     635            0.086"
450            0.064"    1.37"     483            0.084"
300            0.064"    0.39"     316            0.075"
All results used segments lengths equal to the wire spacing. As the segment lengths were lengthened, the 600-ohm line was least affected, but the 300-ohm and 450-ohm lines changed values for each new segment length tried--without a definitive pattern. As the segment lengths increased, the far field from the test model increased from nearly -40 dBi to values in the low 30s. Increasing the wire size brought the line impedance close to the calculated value. Equally, one might widen the spacing.
NEC-2 results with the same models correlated well with NEC-4 results with segment lengths greater than 0.005 wavelength. With shorter segments, the two programs apparently respond somewhat differently to closely spaced wires. Tapered-length transmission line models correlated well between the two programs, especially in the 450-ohm to 600-ohm Zo range.
For many applications, the exact line impedance may be unimportant. However, when physically modeling lines where their impedance does make a difference, running a test model to determine the line Zo is recommended. Physical models of transmission lines are at best somewhat cumbersome. However, they are important to any application where the lines may experience unequal currents and therefore radiate. Typical of such applications is the off-center-fed wire antenna. Comparing the far fields (including both vertical and horizontal components) of the antenna alone and the antenna with its parallel feedline will provide an estimate of such things as the field shape modification occasioned by the feedline, any change of elevation angle of maximum radiation, and any far-field gain changes. An examination of the currents along the transmission line may also be useful in determining the degree of unbalance occasioned by the off-center feed point. Similar exercises may prove useful with other antenna types.
Within their limitations, physically modeled parallel transmission lines can provide useful information, even if in some cases exactitude is sacrificed. To date, I have found no useful technique to model physically a coaxial cable such that the cable model fits within the segmentation limitations of versions of NEC aimed at radio amateurs.
Some Applications for Physically Modeled Transmission Lines
1. The Behavior of Off-Center-Fed Antennas
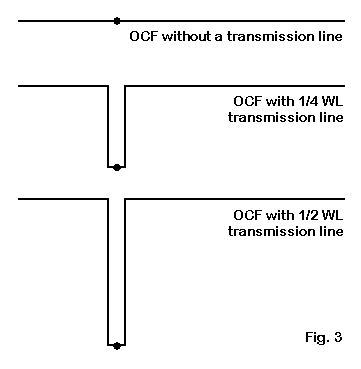
In Fig. 3, we see three on many possible configurations of an off-center- fed 1/2 wl wire antenna (modeled with #12 copper wire at 7.15 MHz for this example at a height of 100' above average ground). We can model this antenna without a transmission line or with any length of line we might choose.
For the example, I have used 1/4 wl and 1/2 wl transmission lines, each composed of #12 copper wire spaced 4.78" apart. The characteristic impedance of the line is approximately 600 Ohms. The segment lengths throughout the model adhere to this length, so that the model with a 1/2 wl line is sizable. Its description appears below as a sample: dimensions are in inches.
40 dipole 7.15 MHz                         Frequency = 7.15  MHz.

Wire Loss: Copper -- Resistivity = 1.74E-08 ohm-m, Rel. Perm. = 1

              --------------- WIRES ---------------
Wire Conn.--- End 1 (x,y,z : in)  Conn.--- End 2 (x,y,z : in)  Dia(in) Segs

1        -244.00,  0.000,1200.00  W2E1  -2.390,  0.000,1200.00    # 12   51
2   W1E2  -2.390,  0.000,1200.00  W3E1  -2.390,  0.000,374.620    # 12  172
3   W2E2  -2.390,  0.000,374.620  W4E1   2.390,  0.000,374.620    # 12    1
4   W3E2   2.390,  0.000,374.620  W5E1   2.390,  0.000,1200.00    # 12  172
5   W4E2   2.390,  0.000,1200.00       557.000,  0.000,1200.00    # 12  117

              -------------- SOURCES --------------
Source    Wire      Wire #/Pct From End 1    Ampl.(V, A)  Phase(Deg.)  Type
          Seg.     Actual      (Specified)

1           1     3 / 50.00   (  3 / 50.00)      1.000       0.000       I

No loads specified
No transmission lines specified
Ground type is Real, high-accuracy analysis
Conductivity = .005 S/m    Diel. Const. = 13

              --------------- MEDIA ---------------
Medium        Conductivity(S/m)   Dielectric Const.    Ht(in)   R Coord(in)

1                 5.000E-03            13.00           0 (def)     0 (def)
I purposely chose the line lengths to illustrate that physically modeling transmission lines can reveal antenna system behavior changes that would not show up without the line. Here is a brief table of results.
Antenna             Gain      TO Angle       Feedpoint Z
                    dBi       degrees        R +/- jX Ohms
No line             7.46      19             107 + j 0
1/4 wl line         2.78      17              95 + j23
1/2 wl line         5.77      18             156 - j61
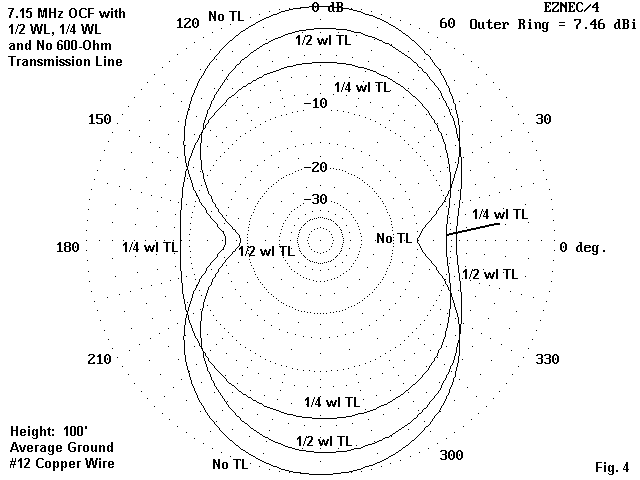
Fig. 4 shows the differences in the azimuth patterns for the three versions of the antenna, each taken at the elevation angle of maximum radiation. The change in feedpoint impedance is partially a function of the mismatch between the transmission line and the characteristic impedance of the line. However, it is also a partial function of the imbalance of current along the line.
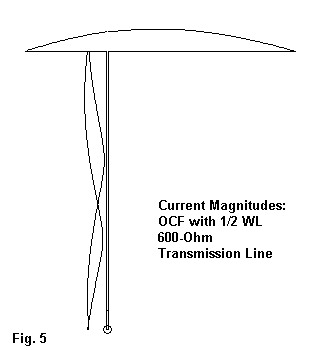
Fig. 5 shows the current magnitudes along both the antenna and the transmission line for the version with a 1/2 wl line. Feedline radiation is not solely a result of current magnitude on the line. Instead, it stems from the difference of current magnitudes and the amount by which they fail to be 180-degrees out of phase. Consequently, it pays to examine the current tables for antennas such as this one in order to uncover the degree of imbalance on the line.
As an exercise, you might well try other line lengths, especially those that are not an easy fraction of a wavelength.
2. A Collinear EDZ Array With Phasing Lines

In Fig. 6, we have a collinear extended-double-Zepp (EDZ) for 21.225 MHz. It is made 129' of #12 copper wire and is 46' above average earth--about 1 wl up. For the moment, we may ignore the current magnitude lines on the graph except to note the multiple occurrences of the typical EDZ current distribution.
Fig. 6 shows the construction of physical models of the phasing lines, composed here of 7' lengths of #12 wire spaced 6" between wires. These shorted stubs have a characteristic impedance of about 650 to 700 Ohms. The description file below shows the antenna geometry fully.
Collinear EDZs                           Frequency = 21.225  MHz.

Wire Loss: Copper -- Resistivity = 1.74E-08 ohm-m, Rel. Perm. = 1

              --------------- WIRES ---------------
Wire Conn.--- End 1 (x,y,z : ft)  Conn.--- End 2 (x,y,z : ft)  Dia(in) Segs

1        -64.500,  0.000, 46.000  W2E1 -36.250,  0.000, 46.000    # 12   33
2   W1E2 -36.250,  0.000, 46.000  W3E1 -36.250,  0.000, 39.000    # 12    5
3   W2E2 -36.250,  0.000, 39.000  W4E1 -35.750,  0.000, 39.000    # 12    1
4   W3E2 -35.750,  0.000, 39.000  W5E1 -35.750,  0.000, 46.000    # 12    5
5   W4E2 -35.750,  0.000, 46.000  W6E1  35.750,  0.000, 46.000    # 12   61
6   W5E2  35.750,  0.000, 46.000  W7E1  35.750,  0.000, 39.000    # 12    5
7   W6E2  35.750,  0.000, 39.000  W8E1  36.250,  0.000, 39.000    # 12    1
8   W7E2  36.250,  0.000, 39.000  W9E1  36.250,  0.000, 46.000    # 12    5
9   W8E2  36.250,  0.000, 46.000        64.500,  0.000, 46.000    # 12   33

              -------------- SOURCES --------------
Source    Wire      Wire #/Pct From End 1    Ampl.(V, A)  Phase(Deg.)  Type
          Seg.     Actual      (Specified)

1          31     5 / 50.00   (  5 / 50.00)      1.000       0.000       I

No loads specified
No transmission lines specified
Ground type is Real, high-accuracy analysis
Conductivity = .005 S/m    Diel. Const. = 13

              --------------- MEDIA ---------------
Medium        Conductivity(S/m)   Dielectric Const.    Ht(ft)   R Coord(ft)

1                 5.000E-03            13.00           0 (def)     0 (def)
The potential performance of this antenna at an elevation angle of 14 degrees is a gain of 13.5 dBi with a beamwidth between -3 dB point of about 16 degrees. The feedpoint impedance is about 250 - j735 Ohms. Fig. 7 shows the azimuth pattern for the antenna model.
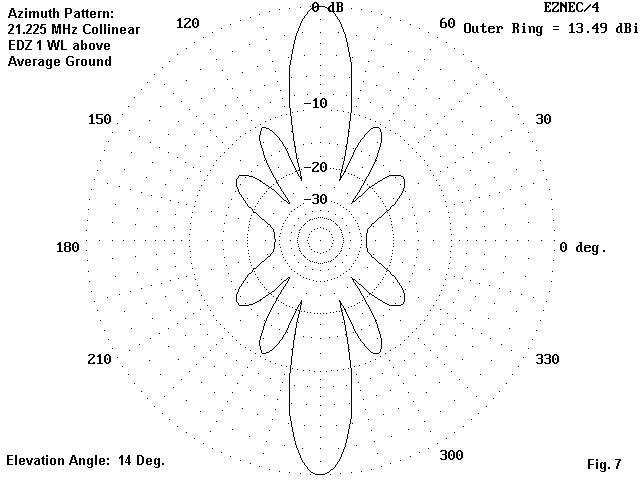
As important as this pattern is the current table. Below is a portion of that table showing the segments just before and after the phasing lines, and the lines themselves. Only one side of the antenna is shown, since the other side has identical current magnitude and phase values.
Collinear EDZs                         Frequency = 21.225 MHz.

         --------------- CURRENT DATA ---------------

Wire No. 1:
Segment  Conn      Magnitude (A.)  Phase (Deg.)
 31                 .53941          -7.26
 32                 .66831          -3.83
 33      W2E1       .79846          -1.52

Wire No. 2:
Segment  Conn      Magnitude (A.)  Phase (Deg.)
 1       W1E2       .97776           0.57
 2                  1.1851           2.37
 3                  1.3554           3.70
 4                  1.4793           4.79
 5       W3E1       1.5519           5.81

Wire No. 3:
Segment  Conn      Magnitude (A.)  Phase (Deg.)
 1       W2E2       1.5713           6.55

Wire No. 4:
Segment  Conn      Magnitude (A.)  Phase (Deg.)
 1       W3E2       1.568            7.25
 2                  1.5154           8.19
 3                  1.4087           9.19
 4                  1.2527          10.36
 5       W5E1       1.0567          11.91

Wire No. 5:
Segment  Conn      Magnitude (A.)  Phase (Deg.)
 1       W4E2       .8601           13.91
 2                  .68562          16.47
 3                  .50825          20.48
In the table, wires 2, 3, and 4 compose the phasing line. We might be drawn to the fact that the current magnitudes on the facing wires (2 and 4) are very close to equal. Hence, we might erroneously conclude that a TL entry might well have substituted for the physically modeled phasing line. However, note the relative current phase between the lines--neither in or out of phase with each other. In fact, substituting TL entries for these physically modeled lines would have yielded an excess gain figure and a quite different feedpoint impedance.
Phasing lines between collinear sections of an antenna are almost always best modeled physically.
3. A Linear-Loaded Dipole

In Fig. 8, we find a linear loaded #12 copper wire short dipole for 28.5 MHz. The total length of the dipole is under 135", about 65% of a full size dipole.
Loading is accomplished with linear loads, which resemble shorted transmission line stubs. In fact, when linear load wires are arranged symmetrically relative to the main dipole wire (for example, in a triangle), transmission line calculations for loading work quite well in figuring the required length for the load lines each side of the center feedpoint. If we omit the linear load, we would find a high value of capacitive reactance at the source point. An equivalent inductive reactance would compensate for the capacitive reactance. We can calculate shorted stubs, each having half the required full value, and they would come very close to lengths required when building an actual linear loaded dipole.
However, the arrangement of lines in this model is linear, with each line a different distance from the main element. The model description tells the story succinctly.
linear-loaded short dipole               Frequency = 28.5  MHz.

Wire Loss: Copper -- Resistivity = 1.74E-08 ohm-m, Rel. Perm. = 1

              --------------- WIRES ---------------
Wire Conn.--- End 1 (x,y,z : in)  Conn.--- End 2 (x,y,z : in)  Dia(in) Segs

1        -67.300,  0.000,  0.000  W2E1  -1.200,  0.000,  0.000    # 12   34
2   W1E2  -1.200,  0.000,  0.000  W3E1  -1.200,  0.000,  3.000    # 12    2
3   W2E2  -1.200,  0.000,  3.000  W4E1 -28.200,  0.000,  3.000    # 12   13
4   W3E2 -28.200,  0.000,  3.000  W5E1 -28.200,  0.000,  6.000    # 12    2
5   W4E2 -28.200,  0.000,  6.000  W6E1  28.200,  0.000,  6.000    # 12   27
6   W5E2  28.200,  0.000,  6.000  W7E1  28.200,  0.000,  3.000    # 12    2
7   W6E2  28.200,  0.000,  3.000  W8E1   1.200,  0.000,  3.000    # 12   13
8   W7E2   1.200,  0.000,  3.000  W9E1   1.200,  0.000,  0.000    # 12    2
9   W8E2   1.200,  0.000,  0.000        67.300,  0.000,  0.000    # 12   34

              -------------- SOURCES --------------
Source    Wire      Wire #/Pct From End 1    Ampl.(V, A)  Phase(Deg.)  Type
          Seg.     Actual      (Specified)

1          14     5 / 50.00   (  5 / 50.00)      1.000       0.000       I

No loads specified
No transmission lines specified
Ground type is Free Space
The linear load lines are spaced 3" apart and 3" from the main element. It makes no difference in free space that the load lines are above the element rather than below it. The free-space gain for the dipole is 1.7 dBi with a feedpoint impedance of 21 - j0 Ohms. Fig. 9 shows the expected dipole pattern.
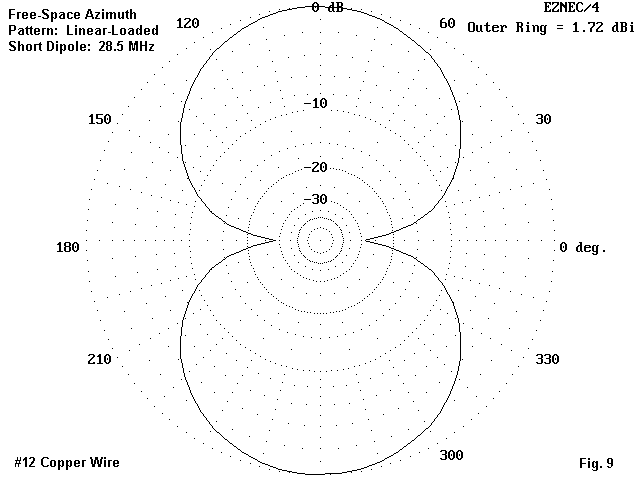
More significant for model construction is the current table, a portion of which appears below.
linear-loaded short dipole              Frequency = 28.5 MHz.

         --------------- CURRENT DATA ---------------

Wire No. 1:
Segment  Conn      Magnitude (A.)  Phase (Deg.)
 21                 .57137          -1.50
 22                 .5929           -1.46
 23                 .61385          -1.42
 24                 .63428          -1.38
 25                 .6542           -1.34
 26                 .67366          -1.30
 27                 .69266          -1.25
 28                 .71122          -1.21
 29                 .72946          -1.16
 30                 .74741          -1.11
 31                 .76522          -1.06
 32                 .7831           -1.01
 33                 .8014           -0.95
 34      W2E1       .82098          -0.88

Wire No. 2:
Segment  Conn      Magnitude (A.)  Phase (Deg.)
 1       W1E2       .84048          -0.81
 2       W3E1       .85779          -0.75

Wire No. 3:
Segment  Conn      Magnitude (A.)  Phase (Deg.)
 1       W2E2       .87723          -0.68
 2                  .89596          -0.62
 3                  .91193          -0.58
 4                  .926            -0.54
 5                  .93844          -0.51
 6                  .94961          -0.49
 7                  .9595           -0.46
 8                  .96827          -0.45
 9                  .97598          -0.43
 10                 .98255          -0.41
 11                 .98806          -0.40
 12                 .99266          -0.39
 13      W4E1       .99633          -0.38

Wire No. 4:
Segment  Conn      Magnitude (A.)  Phase (Deg.)
 1       W3E2       .99895          -0.37
 2       W5E1       1.0021          -0.37

Wire No. 5:
Segment  Conn      Magnitude (A.)  Phase (Deg.)
 1       W4E2       1.0066          -0.36
 2                  1.0109          -0.35
 3                  1.0141          -0.34
 4                  1.0162          -0.33
 5                  1.0174          -0.31
 6                  1.0176          -0.29
 7                  1.017           -0.27
 8                  1.0155          -0.25
 9                  1.0134          -0.22
 10                 1.0105          -0.19
 11                 1.0073          -0.15
 12                 1.004           -0.11
 13                 1.0012          -0.06
 14                 .99999           0.00
Wires 1, 3, and 5 are the parallel sections of wire forming one side of the dipole. These are the wires on which to compare the current magnitudes and phases relative to each other. The current inequalities tell us that the shorted stub is not acting as a pure transmission line. Radiation is not solely a function of the main wire, but of the net current magnitude and phase of the three closely spaced wires composing the linear load and the main element. The current magnitude line in Fig. 8 gives a more graphical view of the rate of change of current along each of the relevant wires.
These examples are samples of when physically modeling transmission lines will provide a more accurate model than using the TL facility. Wherever the current at the terminals of the line is not equal, the line will contribute to the far field radiation pattern--either adding to or subtracting from the overall pattern. Under those conditions, physically modeling the transmission line will always be more accurate than using the TL facility in NEC.