A continuing source of confusion among newer modelers is the data that NEC produces concerning power and the source conditions. Few modelers realize that they have both limitations and opportunities in these parts of modeling. So let's look a little closer at both arenas.
Power
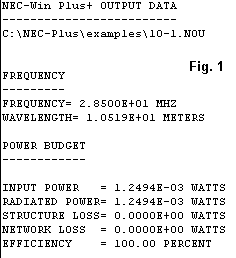
NEC provides a "power budget" report as part of its standard report. Although this report is accessible to users, few ever look at it in detail. A typical power budget appears in Fig. 1.

Without supplementary data, the numbers may be of little use. The model involved in this report is a folded dipole for 28.5 MHz. The actual power budget consists of 5 entries.
The input power is that supplied to the antenna at the source (or sources). It is a direct function of two factors: the source specified by the modeler and the source impedance calculated by the program. Let's assume that we opted for a 1 volt, 0-degree source--the most commonly used with NEC. NEC itself uses peak volts and reports output voltages and current in peak values. Programs like NEC-Win Plus use these values directly. Programs like EZNEC accept only r.m.s. values as inputs and report r.m.s. values as outputs. Adjustments needed to work with the core are made internally within the program.
NEC calculated for the segment on which the source happens to be placed an impedance of 398.8 + j23.5 Ohms, or 399.5 Ohms at a phase angle of 3.375 degrees. NEC calculated a peak current of 0.0025 A at a phase angle of 3.375 degrees. This is a simple application of Ohms law, dividing the specified voltage by the impedance of the source segment.
Now let the power, P, equal the traditional I2R. If we take only the current, which is 0.0025031 A (to be overly precise), square it, and multiply by the real or resistive part of the source impedance (398.815 Ohms), we get a power report of 0.0024988 watts, which is double the power reported in Fig. 1. However, Fig. 1 reports the NEC core peak value for current. The r.m.s value of current is 0.707 times the peak value. In other terms, the power (always an r.m.s. value) is half the value calculated from the peak current value. The result is 0.0012494 watts, just the value that Fig. 1 reports in engineering notation.
Notice that the radiated power has the same value. The structure losses, here reported as zero, are a function of the material we specify for the wires of the model. This model evidently specified perfect conductors and no load with resistive components. There are also no network losses, meaning that the model has no networks with resistive components.
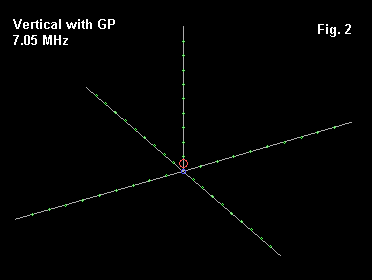
When the Radiated Power equals the Input Power, the efficiency is 100%. NEC always calculates efficiency as a ratio of radiated power to input power (times 100, of course). The efficiency will include only those losses internal to the antenna model structure, including material losses, load losses, and network losses. Not included are any external factors that affect the antenna's environment. Let's illustrate using the simple ground-plane vertical for 7.05 MHz in Fig. 2. We shall initally use no loads and specify perfect conductors for all 5 wires. Also, we shall use the Sommerfeld-Norton ground system and average soil.

Here is the basic description for this small model
1/4 wl w/GP: 7.05 MHz                        Frequency = 7.05  MHz.

Wire Loss: Zero

              --------------- WIRES ---------------

Wire Conn.--- End 1 (x,y,z : m )  Conn.--- End 2 (x,y,z : m )  Dia(mm) Segs

1          0.000,  0.000, 10.135  W2E1   0.000,  0.000,  0.000 5.00E+01  10
2   W3E1   0.000,  0.000,  0.000        11.796,  0.000,  0.000 6.35E+00  10
3   W4E1   0.000,  0.000,  0.000         0.000, 11.796,  0.000 6.35E+00  10
4   W5E1   0.000,  0.000,  0.000       -11.796,  0.000,  0.000 6.35E+00  10
5   W1E2   0.000,  0.000,  0.000         0.000,-11.796,  0.000 6.35E+00  10

              -------------- SOURCES --------------

Source    Wire      Wire #/Pct From End 1    Ampl.(V, A)  Phase(Deg.)  Type
          Seg.     Actual      (Specified)

1          10     1 / 95.00   (  1 /100.00)     56.984       0.000       V

No loads specified

No transmission lines specified

Ground type is Real, high-accuracy analysis
Conductivity = .005 S/m    Diel. Const. = 13

              --------------- MEDIA ---------------

Medium        Conductivity(S/m)   Dielectric Const.    Ht(m )   R Coord(m )

1                 5.000E-03            13.00           0 (def)     0 (def)
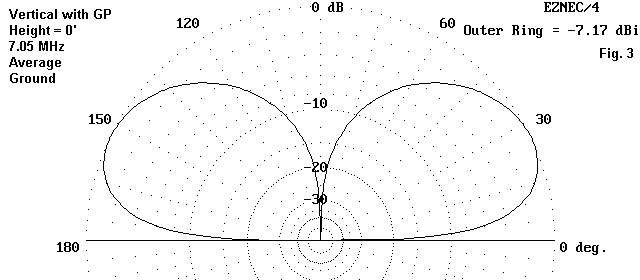
Using NEC-4, let's places the ground plane directly on the ground, that is at Z=0. (We cannot do this with NEC-2, which demands that the base of the antenna be elevated slightly above ground.) The resulting elevation pattern for the antenna appears in Fig. 3.

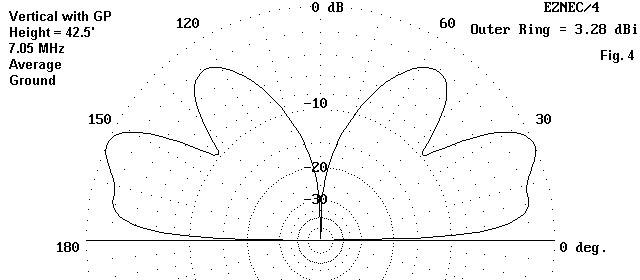
Now let's place the antenna at a height of 42.5 m (1 wl) above ground, changing nothing in the model except the values for the Z-coordinates. The result is an elevation pattern like that in Fig. 4.

Despite the differences between the two patterns, both antennas show an efficiency of 100%, that is, a 1:1 ratio between the input power and the radiated power.
In fact, we can look at the power budgets for three conditions: 1. the perfect (lossless) wire model with no loads, 2. the same model with aluminum wires, and 3. a shortened aluminum wire version with a loading coil of 200 Ohms reactance and 1 Ohm resistance (Q= 200). The power budgets look like this:
Height         Input Power    Radiated Power      Wire Loss      Efficiency
  m                 W              W                   W              %
No wire or load losses
 0             9.9992E+00     9.9992E+00          0.0000E+00     100
42.5           1.5162E+02     1.5162E+02          0.0000E+00     100
Aluminum wire, no load
 0             9.9979E+00     9.9952E+00          2.7137E-03      99.97
42.5           1.5079E+02     1.4993E+02          8.5922E-01      99.43
Aluminum wire, load (1+j200 Ohms)
 0             1.2004E+01     1.1927E+01          7.7168E-02      99.36
42.5           2.8589E+02     2.5892E+02          2.6971E+01      90.57
No entry for network loss will appear unless we introduce a network to the antenna system. However, we read in the chart differences of efficiency. Some are easy to interpret. For each height, we see a reduced efficiency as we add losses to the system--first the wire material, then the loading coil. However, we also see a difference in efficiency between ground and elevated mounting of the antenna. The efficiency goes down as the height goes up, although the maximum gain goes up with height.
The efficiency differences for each case result from the fact that we are dealing with I2R losses. The ground-mounted model shows an impedance over ten times that of the version 1 wl up. There is also a similar difference in current, with the elevated model showing the higher value. When each of the two currents is squared, a fixed resistance shows a greater loss in dissipated power. Nonetheless, the difference made by material losses is small in terms of far field radiation (<0.02 dB). The shorter, loaded version of the antenna shows about 2.2 dB lower strength in the ground mounted version and about 0.4 dB lower strength in the elevated model.
The maximum gain difference between the two sets of models--well over 10 dB--is, with respect to NEC, a function of the interaction of the antenna's radiation with its environment. NEC does not take the environmental factors into account when calculating efficiency. Analyses of the relative effectiveness of two antenna models must be done externally, normally beginning with the relative gain values, pattern shape, and similar factors.
What NEC does do when it has a constant 1 volt, 0-degree phase angle source is to account for the effects of the environment in the impedance of the source segment. The perfect-wire elevated vertical shows an input impedance of 21.4 - j0.6 Ohms, while the version planted on the ground has a source impedance of 191.1 - j159.8 Ohms. The result is different values of current on the source segment: 0.0467 A vs. 0.0040 A. (Since the values for the current vertical model are taken from EZNEC, they are r.m.s. values.) The result is a large difference in input power: 0.0467 W for the elevated vertical vs. 0.0031 W for the ground-mounted version. In each case, the antennas radiate all of the input power and have efficiencies of 100%.
Note the fact that the power for the elevated vertical has a numerical value which is the same as the numerical value of the current. Since the impedance is well over 99% resistive, the value of I2R and I2Z are virtually identical. However, for the ground mounted vertical, the impedance is highly reactive. Only the resistive or real portion of the impedance enters into the power calculation, and 0.00402 times 191.1 yields the value for the input (and the radiated) power.
The Convenience of 1 Amp
When using a voltage source in NEC, the current values that emerge along each wire tend to have inconvenient values. It is difficult to sense the slope of a curve, even though graphical representations of the relative current are helpful visual aids to this process. What can we do to obtain more convenient numerical values?
If all segment currents are referenced to a source current value of 1.0, the user can much more readily see the relationships among values at various segments along the wires making up the antenna. One easy way to do this is to specify a current source and give it a value of 1.0 at phase angle zero. However, a current source in NEC is created by a remote network normally invisible to the program user. Under certain conditions, a current source may not be as reliable as a voltage source. One case in which this is true is where the currents on wire segments adjacent to the source segment are not equal to each other. This phenomenon can occur where the feedpoint occurs at the corner of an element and the two sides are not of equal length or form a non-symmetrical structure relative to the source.
There is way to provide a source current of 1.0 A at a phase angle of 0 degrees and to stay within the a voltage source mode. This technique applies to single source antenna models. First, assign the model a normal voltage source value of 1.0 V at 0-degrees phase angle. Run the model and note the current magnitude and phase. Let us say that we get a report of 0.024 at -16.12 degrees.
Now take the inverse of the current magnitude, in this case 41.67 and enter it as a new voltage source value. For the source phase angle, use the negative of the current phase angle. In this case, we began with a negative phase angle, so we would enter a positive 16.12 degrees. At the specified frequency for the model, the current will now read 1.0 A at 0-degrees phase angle.

Fig. 5 can let us quickly demonstrate the utility of using 1 Amp as a source reference. Consider the current profile along the dipole segments. The following table will show only one half of the model, since the other half is a mirror image. You may decide which set of numbers provides the intuitively clearer portrait of the antenna's current levels.
Source                   Segment Number and Current Report
 Type          1 (End)   2         3         4         5         6 (Center)
1 Volt         .00237    .00645    .00984    .01241    .01403    .01458
1 Amp          .0126     .4425     .6746     .8514     .9622     1.000
This technique is useful only at the design center frequency for the antenna model. Since the impedance will change as we alter the frequency of interest, so too will the required voltage source values to achieve a 1 A current. However, for single frequency investigations of current along antenna elements, the technique is a quick and easy way to view all current magnitudes in relationship to a source value of 1 and current phase angles in relationship to a source value of 0 degrees.
Power Specification
For some applications, it is useful to provide an antenna source with a set power level. Some programs, such as EZNEC provide this option. The program simply takes the core output and recalculates relevant values in terms of the power its sets based on what NEC reports using a standard source input set of values.
For programs that do not have this provision, we can do the job ourselves. Let's work through an example, using our ground-mounted 7.05 MHz vertical. If we provide the model with a voltage source of 1.0 at 0-degrees phase angle, it returns the following source data.
This is all the data we need to set a power level. Since these are EZNEC reports, the values are r.m.s. Our goal is to find the voltage magnitude needed for some specific power level. Let's set 10 watts as the required level.
First, we need to find the impedance magnitude, which is
where Z, R, and X have their usual meanings. For the example, the impedance is 249.11 Ohms.
The value of voltage to use at the source is simply

where P is 10, the power we selected, and Z is the impedance magnitude we just calculated. Theta is the phase angle, which for the example is simply 39.90 degrees. Since the collection of values is highly interrelated, there are other ways to arrive at the same numbers, but this one will certainly work. For the example, the desired voltage to supply the source with 10 watts is 56.98 Vr.m.s.
If program needs demand a peak voltage value, we may simply multiply the r.m.s. value by 1.414 to arrive at 80.57 Vpk. Since the input voltage derivation uses values of power and impedance, the resulting calculation will always yield an r.m.s. voltage value which requires conversion for programs needing the peak value.
There are numerous applications for which the specification of a specific power level is either necessary or desirable. One of the most important is the analysis of ground wave values. The RP1 output of NEC yields the total ground wave radiation. The user specifies--in the most usual type of case--a distance from the antenna and a height above ground for the reading. (This assumes that the antenna is centered at a location where the X and Y axis values are both zero.) NEC will report calculated values of radiation in volts per meter (which might be reported as mV/m in the user output report).
The ground wave output is very useful in estimating the results of making changes in the antenna, changes that in each case might change the source impedance. With changes in source impedance and a simply voltage source, the input power to the antenna may be different for each modification. Recalculating the source voltage to give a uniform power input for each version of the antenna will make the ground wave output reports comparable. A similar utility to using a constant power input to the antenna applies when trying to compare different antennas at the same position.

Fig. 6 illustrates a second instance where a constant power level can make instantly sensible current values that might otherwise seem initially confusing. The antenna is an open-double rectangle, fed either on the end vertical or on the center vertical. The array produces vertically polarized energy in the main, and is useful in the MF through lower HF region.
If we provide the end-wire source with 1 A, using a current source, then feeding the end element produce a current on the end vertical center-point of 1.0 A and at the midpoint of the center vertical of 1.84 A. If we move the source to the center-wire, the current readings are 0.54 on the end wire and 1.0 on the center wire. The ratios are the same, but the values differ. Of course, an ideal double rectangle with no losses and no ground effects would show vertical element current ratios of 1:2:1 from end to end. So too would any three equal length verticals spaced in a line at 1/2 wl intervals.
The current value differences result from the change of source impedance when we move the source position. The ratio of impedances (28.4 - j11.0 to 8.6 - j3.0 Ohms) between end and center feeding is roughly the square of the ratio of currents. However, if we select a constant power--say, 10 watts--we get the following numeric current values. End feed: end wire = 0.59; center wire 1.09. Center feed: end wire 0.58; center wire 1.08. Had we used lossless wire, the numeric values would have been even closer. Nonetheless, the use of a constant power level relieves use from having to make further calculations to correlate current values on the elements of the open-double rectangle.
These samples only begin to demonstrate the advantages of being able to transform source voltage, current, impedance, and power numbers from their initial input and report values into other values of more instant utility. Becoming more familiar with the power and source values used and reported by NEC can make the program (and its commercial implementations) more productive for even the casual user.