When we work with models of directional arrays, such as Yagi-Uda beams, we take great interest in the front-to-back ratio reported by either NEC or MININEC software. However, I am not certain we always fully appreciate the data provided to us by our models. Let's look at Fig. 1 as an illustration.
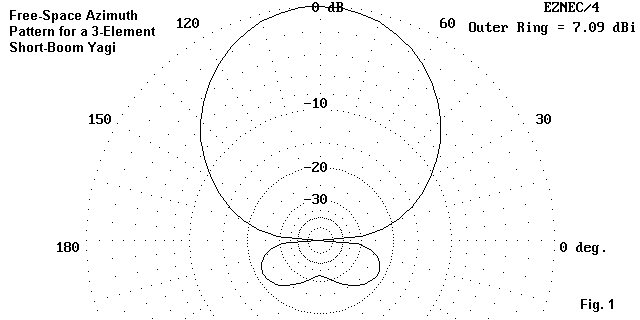
Fig. 1 is the free-space azimuth pattern of a short-boom 3-element Yagi. Both EZNEC and NEC-Win software report the gain at 28.4 MHz as 7.09 dBi. However, EZNEC reports a front-to-back ratio of 32.56 dB, while NEC-Win reports that the front-to-back ratio is 21.63 dB.
Is one of the software packages deeply in error? Not a bit. Each is simply reporting the front-to-back ratio according to a different but valid definition. Actually, there are three working notions of front-to-back ratio generally current in antenna work. Let's begin with the two that are relevant here.
180-Degree front-to-back ratio: This ratio is simply the difference in gain between the maximum forward gain bearing and another bearing 180 degrees opposite.
Worst-case front-to-back ratio: This ratio uses the maximum gain anywhere in the rear quadrants as the basis for establishing the ratio relative to the maximum forward gain. In most instance, the side points, as defined by the 90-degree angle from the maximum forward gain heading, determine where the rear quadrants begin.
If we compare the azimuth pattern in Fig. 1 with the two definitions, we begin to suspect that EZNEC is reporting the 180-degree ratio, while NEC- Win is reporting the worst-case ratio. However, we need not guess; we can find out easily enough from the far-field radiation tables, a portion of which we can view here.
Azimuth Pattern   Elevation angle = 0 deg
Deg    V dB      H dB      Tot dB       Deg    V dB      H dB      Tot dB
 90    -99.99      7.09      7.09       180    -99.99    -99.99    -99.99
 95    -99.99      7.03      7.03       185    -99.99    -24.24    -24.24
100    -99.99      6.83      6.83       190    -99.99    -19.24    -19.24
105    -99.99      6.50      6.50       195    -99.99    -16.80    -16.80
110    -99.99      6.03      6.03       200    -99.99    -15.47    -15.47
115    -99.99      5.42      5.42       205    -99.99    -14.78    -14.78
120    -99.99      4.67      4.67       210    -99.99    -14.54    -14.54
125    -99.99      3.78      3.78       215    -99.99    -14.65    -14.65
130    -99.99      2.73      2.73       220    -99.99    -15.05    -15.05
135    -99.99      1.52      1.52       225    -99.99    -15.70    -15.70
140    -99.99      0.12      0.12       230    -99.99    -16.59    -16.59
145    -99.99     -1.49     -1.49       235    -99.99    -17.69    -17.69
150    -99.99     -3.34     -3.34       240    -99.99    -18.97    -18.97
155    -99.99     -5.50     -5.50       245    -99.99    -20.40    -20.40
160    -99.99     -8.08     -8.08       250    -99.99    -21.88    -21.88
165    -99.99    -11.28    -11.28       255    -99.99    -23.28    -23.28
170    -99.99    -15.57    -15.57       260    -99.99    -24.44    -24.44
175    -99.99    -22.41    -22.41       265    -99.99    -25.21    -25.21
                                        270    -99.99    -25.47    -25.47
For the antenna orientation in the model, 90 degrees represents the peak forward gain heading and shows a gain of 7.09 dBi. Directly opposite, at an angle of 270 degrees, we read a gain of -25.47 dBi. The 180-degree front-to-back ratio is the forward gain minus the gain directly opposite:
The rear quadrants begin at an angle of 180 degrees, 90 degrees the the rear of the maximum forward gain heading. At an angle of 210 degrees, we find the peak gain in the rear quadrants: -14.54 dBi. The worst case front-to-back ratio is the highest forward gain minus the highest gain in the rear quadrants:
Of course, the tables can always be used to find any set of gain relationships we may desire to know. They are a too-little used portion of the data available from NEC or MININEC models.
For the present case, one might wish to ask which of the two front-to-back figures is "right," "more accurate," or "more important." Actually, both figures are equally right and accurate, since both calculate with equal precision from the data. Importance is a judgment to be gleaned from the concerns we bring to the investigation. If we are concerned about rear quadrant QRM in general, then the worst-case figure may be a more useful indicator of the likely levels we might experience when using this antenna. If we are seeking the best figure we can obtain relative to the immediate rearward direction, then the 180-degree figure may be more useful.
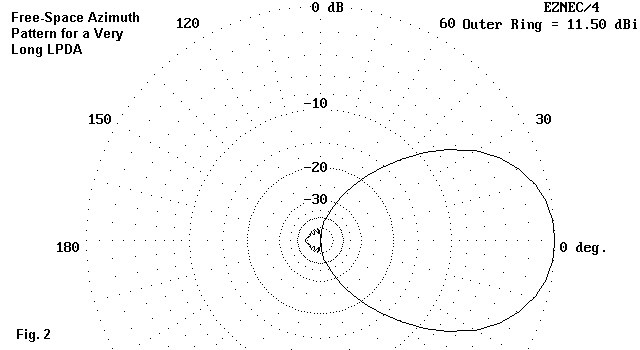
In some cases, the difference may not make much of a difference. Fig. 2 shows the free-space azimuth pattern for a very long 1-octave LPDA. For most practical purposes, any measure would suffice, since the radiation to the rear does not exceed -40 dB in any rearward direction. Nevertheless, the pattern does reveal another facility of NEC and MININEC programs that we use too little--the ability to expand the plotting scale to investigate small pattern features.
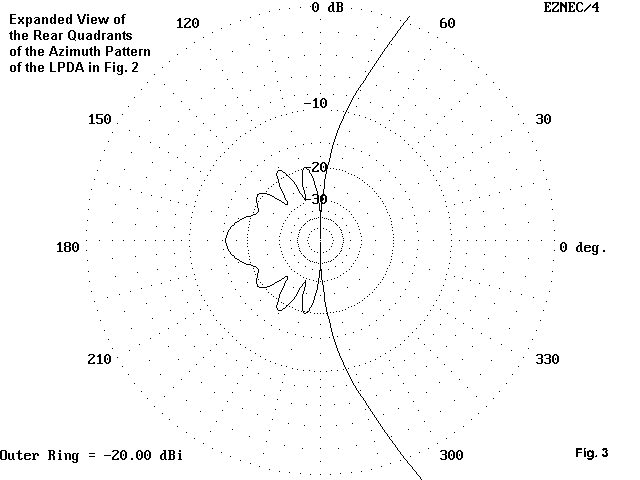
Fig. 3 sets the outer limit of the plot at -20 dB. This move automatically expands the rear quadrant lobes to much more visible proportions. Here, we can clearly see that no lobe to the rear exceeds the one which is 180- degrees opposite to the forward lobe. However, the gain value may seem odd: about -15.5 dB from the outer ring value. If we add this value to the outer ring value of -20 dB, we find the 180-degree lobe to have a gain of -35.5 dB. If we then use the 11.5 dBi gain of the forward lobe as our reference, we obtain a 180-degree front-to-back ratio of 47.0 dB. Since the 180-degree rear lobe is the strongest within the rear quadrants, this value is also the worst-case front-to-back ratio.
The very high front-to-back ratio exhibited by the long LPDA may be very significant to commercial applications. Indeed, the long LPDA has in many arenas supplanted other wire arrays, and the high potential front-to-back ratio is one important reason (along with the absence of side lobes). Most amateur radio antenna applications tend to settle for a minimum front-to- back ratio of 20 dB, with anything more being a bonus. Hence, the 180- degree and the worst-case ratios might equally satisfy amateur antenna users. (Still, we know which of the two figures an advertiser is more likely to use.) Nonetheless, we might adjudicate the differential we often find between the two numbers by appealing to a third front-back notion.
Front-to-rear ratio: To overcome misleading aspects of both 180-degree and worst-case front-to-back ratios, some engineers have adopted the front-to- rear ratio. This ratio is based on averaging the power gain of the antenna over the rear quadrant and using the resulting figure as the basis for a ratio with the forward gain. There is no general standard on exactly how many data points to use or where to locate them.
Let's do a simple calculation relative to the antenna in Fig. 1 and its far-field table: since our antenna pattern is symmetrical on each side of the center line from front-to-rear, let's just add up the gain values at 5- degree intervals from the side point to the rear point and then obtain their average by dividing the total by the number of data point. There are statistically more sophisticated ways to obtain an average valuse, but this simple exercise can be easily checked by consulting the table above.
Skipping the -99.99 side inset value, we obtain a total of -344.40 for the 18 points from 185 degrees through 270 degrees. The average gain for the quadrant is -19.13 dBi. Since the forward gain is 7.09 dBi, the front-to- rear ratio is
The front-to-rear ratio becomes a reasonable evaluation of overall rearward performance as we compare it a. to the smooth rearward lobes of the antenna pattern in Fig. 1 and b. to the 180-degree and the worst-case values, which are higher and lower, respectively, to the front-to-rear ratio we just roughly calculated. In this case, using any one of the three ratios would not seriously mislead a potential user of the antenna.
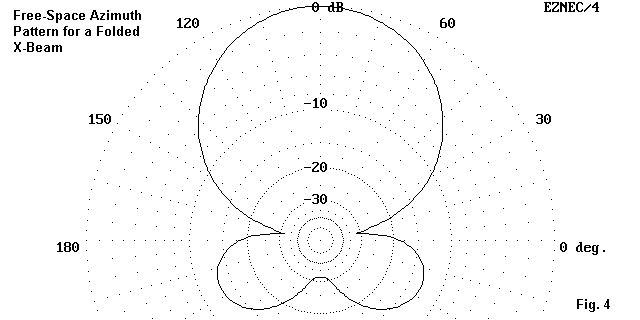
There are cases, however, in which no single figure will adequately evaluate an antenna's rearward performance. Fig. 4 is the free-space azimuth pattern of a folded X-beam. Below is a partial set of gain values.
Azimuth Pattern   Elevation angle = 0 deg
Deg    V dB      H dB      Tot dB       Deg    V dB      H dB      Tot dB
 90    -99.99      7.34      7.34       185    -99.99     -8.64     -8.64
 95    -99.99      7.28      7.28       190    -99.99     -7.10     -7.10
100    -99.99      7.11      7.11       195    -99.99     -6.17     -6.17
105    -99.99      6.82      6.82       200    -99.99     -5.67     -5.67
110    -99.99      6.41      6.41       205    -99.99     -5.52     -5.52
115    -99.99      5.86      5.86       210    -99.99     -5.68     -5.68
120    -99.99      5.18      5.18       215    -99.99     -6.12     -6.12
125    -99.99      4.34      4.34       220    -99.99     -6.84     -6.84
130    -99.99      3.33      3.33       225    -99.99     -7.86     -7.86
135    -99.99      2.11      2.11       230    -99.99     -9.18     -9.18
140    -99.99      0.65      0.65       235    -99.99    -10.86    -10.86
145    -99.99     -1.14     -1.14       240    -99.99    -12.93    -12.93
150    -99.99     -3.35     -3.35       245    -99.99    -15.46    -15.46
155    -99.99     -6.21     -6.21       250    -99.99    -18.41    -18.41
160    -99.99    -10.20    -10.20       255    -99.99    -21.47    -21.47
165    -99.99    -16.67    -16.67       260    -99.99    -23.64    -23.64
170    -99.99    -23.93    -23.93       265    -99.99    -24.26    -24.26
175    -99.99    -15.57    -15.57       270    -99.99    -24.26    -24.26
180    -99.99    -11.14    -11.14
Using the 90 and 270 degree points, we obtain a 180-degree front-to-back ratio of 31.60 dB. Using the 90-degree point and the 205-degree point, where rearward gain is highest, we obtain a worst-case front-to-back ratio of 12.86 dB. For the third figure we shall again average the values between 185 degrees and 270 degrees (even though the minimum gain bearing is 170 degrees rather than 180 degrees) and divide by the 18 points to get a -12.23 dBi average rearward gain. The resulting front-to-rear ratio is 19.57 dB.
The very high disparity among the three values makes it dubious whether one of those values would fully inform a potential antenna user. The very high 180-degree front-to-back value is very misleading unless QRM from quartering rear directions is judged in advanced to be an insignificant consideration. Even the front-to-rear ratio overrates the antenna's rearward performance by at least a receiving S-unit (6 dB) relative to the gain of the antenna at the 205-degree bearing and its counterpart to the other side. Nonetheless, using only the worst-case value can under- estimate antenna performance overall.
In the end, obtaining all three figures and applying them in conjunction with careful observation of the azimuth pattern may be the only means of arriving at a satisfactory evaluation of the design. Of course, this evaluation only makes sense in the context of a set of performance objectives and needs.
Simple techniques of calculating front-to-rear ratios, such as the one we have used to illustrate the principle, suffer limitations. One such limitation is illustrated in Fig. 5.
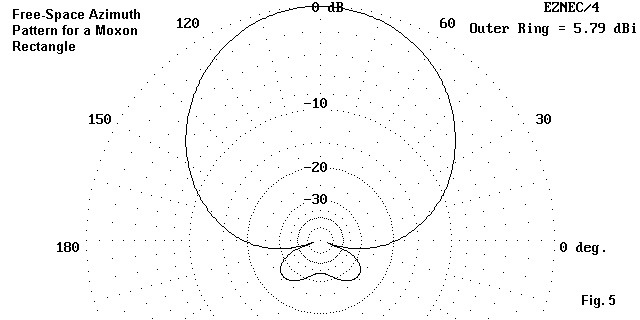
The free-space azimuth pattern of the Moxon rectangle seems innocent enough until we try to calculate a front-to-rear ratio. Here is the table for our task.
Azimuth Pattern   Elevation angle = 0 deg
Deg    V dB      H dB      Tot dB       Deg    V dB      H dB      Tot dB
 90    -99.99      5.79      5.79       180    -99.99    -13.37    -13.37
 95    -99.99      5.74      5.74       185    -99.99    -16.95    -16.95
100    -99.99      5.60      5.60       190    -99.99    -21.96    -21.96
105    -99.99      5.35      5.35       195    -99.99    -31.20    -31.20
110    -99.99      5.01      5.01       200    -99.99    -36.45    -36.45
115    -99.99      4.57      4.57       205    -99.99    -26.38    -26.38
120    -99.99      4.03      4.03       210    -99.99    -22.85    -22.85
125    -99.99      3.38      3.38       215    -99.99    -21.12    -21.12
130    -99.99      2.63      2.63       220    -99.99    -20.33    -20.33
135    -99.99      1.78      1.78       225    -99.99    -20.15    -20.15
140    -99.99      0.80      0.80       230    -99.99    -20.43    -20.43
145    -99.99     -0.29     -0.29       235    -99.99    -21.10    -21.10
150    -99.99     -1.52     -1.52       240    -99.99    -22.10    -22.10
155    -99.99     -2.89     -2.89       245    -99.99    -23.34    -23.34
160    -99.99     -4.44     -4.44       250    -99.99    -24.73    -24.73
165    -99.99     -6.20     -6.20       255    -99.99    -26.07    -26.07
170    -99.99     -8.21     -8.21       260    -99.99    -27.15    -27.15
175    -99.99    -10.55    -10.55       265    -99.99    -27.82    -27.82
                                        270    -99.99    -28.04    -28.04
The 180-degree front-to-back ratio is 33.83 dB. If we use our standard simple front-to-rear calculation for headings from 185 degrees through 270 degrees, we obtain a value of 30.13 dB. However, this value includes points within the main lobe as well as the deep side null--which occurs at 200 degrees. In some easy cases, the higher main lobe values may offset the side null, but in other cases, the inclusion of these value may skew the overall performance. If we use only those values from 205 degrees onward, the average rear gain becomes -23.69 dBi for a front-to-rear ratio of 29.48 dB. Although the differences from the simple calculation is not great in this case, the inclusion of main lobe and side null values reduces the degree of trust we can place in the first result. The fact that the revised front-to-rear ratio is different from the simple result should suffice to illustrate the care that must be used in developing such front- to-rear values.
So far, we have worked with symmetrical azimuth patterns and could therefore use only one of the rear quadrants to calculate a front-to-rear ratio. Consider Fig. 6
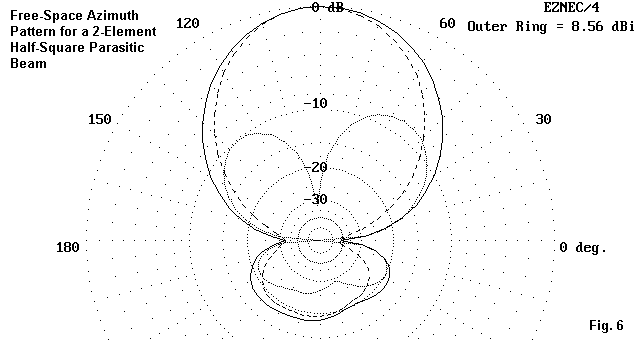
The azimuth pattern for the half-square 2-element parasitic array has a feedpoint that is necessarily offset from center. Hence, as the vertical and horizontal components of the overall pattern show, there is good reason for the total azimuth pattern to be slightly non-symmetrical. The forward lobe is scarcely affected, but the rear pattern shows great unevenness.
Had we calculated the front-to-rear ratio by our simple method, the result would be too high or too low, depending on from which side of the center- line we draw our data. Obviously, an operational method of developing front-to-rear ratios should include both halves of the rear radiation pattern. Very likely, the operational method should also include a much finer resolution (perhaps to 1 degree) to obtain many more data points than we have used in our illustrations.
So far, all of our sample cases have used free-space azimuth patterns. We have a dangerous tendency to assume that, when we take azimuth patterns at some antenna height over ground, the maximum rear gain occurs at the same elevation angle as the maximum forward gain. Therefore, the resulting front-to-back ratio becomes a safe estimate for the antenna's performance for signals from the rear of the antenna.
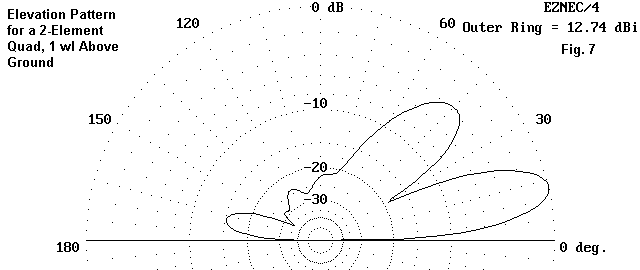
Fig. 7 illustrates our presumptions in action. I purposely chose a quad model with significant rearward radiation to make the rear lobe clear in the elevation pattern. In this case, and in a large number of other cases involving horizontally polarized antennas, the rear lobe angle of maximum radiation is the same as the forward lobe angle of maximum radiation: about 13 degrees above the horizon for this illustration.
However, it is never safe to assume that this phenomenon is universal. For example, see Fig. 8.
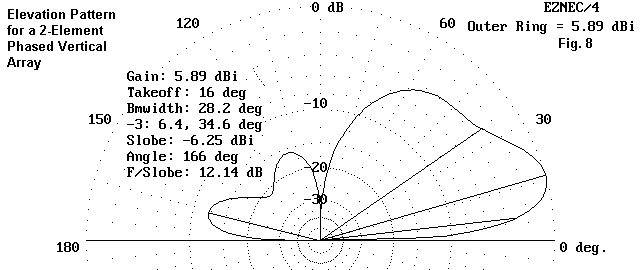
The elevation pattern for this phased array of vertical elements shows a forward elevation angle of maximum radiation of 16 degrees. The corresponding rear elevation angle of maximum radiation is two degrees lower, at 14 degrees above the horizon. Although the difference may not make a very significant operational difference with this array. it does illustrate the need to locate such angles when evaluating the front-to-back or front-to-rear performance of an antenna placed over real ground. In this case, the elevation pattern supplements simple azimuth patterns. Of course, we can always turn to the far field tables for both elevation and azimuth patterns to complete our data needs.
Many antenna modelers approach the software with limiting assumptions. Perhaps the most common are oversimplifications of the idea of a front-to- back ratio. In this set of exercises, I hope we have gone some distance in showing this basic idea to be somewhat more complex than some of us suspected. But more importantly, I hope the exercises have shown some of the resources within NEC and MININEC with which we can do a full analysis and evaluation of an antenna's rearward performance.