 No. 3: Where Does the Gain Come From?
Earlier, we looked at 3 antennas modeled in free space: a dipole, a 2- element Yagi, and a 3-element Yagi. All were made from aluminum tubing and all were monoband antennas with no traps or other lossy components. The patterns we showed made it clear that the 3-element Yagi had the most gain and the highest front-to-back ratio. But that does not make it very clear from where the gain comes, given a constant transmitter output.
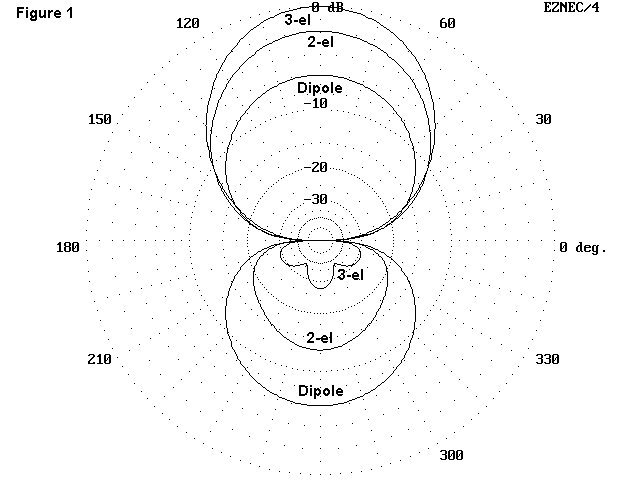
Fig. 1 repeats the azimuth patterns to refresh our memory. An azimuth pattern is like standing over the antenna and seeing its radiation. For free space patterns, we use 0ø elevation, since the pattern is strongest straight on.

The azimuth pattern does not give a whole picture of where the power is going. It does show that the beams project more power in the forward direction than the dipole, while "robbing" power from the rear. In reception terms, signals from straight ahead are strongest and weaker to the rear. However, they are weakest off the sides of the antennas.
To accurately see the power pattern of an antenna, we must also look at it from the side in an elevation pattern. An elevation pattern is like standing beside the antenna and looking through the aluminum tubes, while seeing the radiation. Fig. 2 gives an elevation pattern in free space for the same 3 antennas (3-element, 2-element, and dipole). Notice the displacement of the beam antenna patterns to the right, which corresponds to the forward lobe of the beam antenna azimuth patterns.

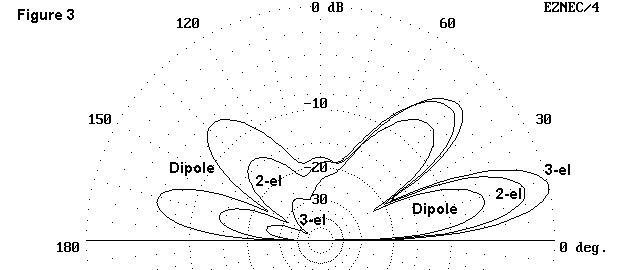
Only an astronaut can have a pattern radiating below the antenna site. Antenna gain over real ground also makes use of radiation reflected from the ground. Fig. 3 shows elevation patterns for the three antennas over real ground at 35' feet, about 1 wavelength above ground. The azimuth patterns would resemble those of Fig. 1, but they would not be taken at horizon level. Instead, they would use the angle of maximum power, sometimes called the take-off angle. The elevation patterns display this angle clearly and show that horizontal antennas above a real ground have a number of higher angle lobes as well as the main lobe. The complex pattern results from adding and subtracting reflected radiation from the above- ground pattern, depending on its relative phase.

Comparing Fig. 2 to Fig. 3 can lead to a misunderstanding, since the
apparent radiation pattern is the same size; that is, the radiation just
reaches the outer ring. However, that way of styling our drawings is just
a convenience for making comparisons within each drawing. In actuality,
the power in the lowest lobe of Fig. 3 for each type of antenna is much
greater than the power in just the horizontal direction of Fig. 2.
Expressed another way, all of the power represented by the spheres or near-
spheres in Fig. 2 is flattened, thus putting greater power into the lobes
that extend horizontally. The total power in the lobes is a result of
adding reflections to the main or incident power going that way. The net
result is gain over free space and gain of one antenna over another. And
since the gain can be both calculated and controlled by good antenna
design, we can--within limits--achieve a good bit more success than early
radio pioneers in making and maintaining radio communications.
Updated 3-17-97. © L. B. Cebik, W4RNL. Data may be used for personal purposes, but may not be reproduced for publication in print or any other medium without permission of the author.