 Notes on Fat-Wire Dipole Convergence:
A standard dipole at HF made from commonly used materials can be accurately modeled in any of the NEC-based programs using minimally recommended segmentation. Convergence testing (increasing the segmentation density) confirms the accuracy of the model for virtually any purpose the model might be used.
Similar behavior is often expected from dipoles of increasing diameter, for example up to 1' at 14 MHz. The circumference divided by the radius must be much less than 1, a condition easily met by this large dipole. MININEC prefers the largest minimum segment length to diameter ratio: 1.25:1. This condition is easily met if the segmentation density is about 40 per half-wavelength or less.
Even within program limitations, however, the modeler encounters some interesting program-to-program variations that are worth noting. They may not be operationally significant in terms of model reliability. Still, they will increase our awareness of program tendencies and trends, thus enabling the modeler to view a certain set of progressions as either expected or unusual.
To see what happens with fat dipoles, I systematically modeled a sequence of resonant dipoles at 14.0 MHz. Since I was interested in the numerical progressions (rather than operationally-relevant limitations), I defined resonance as a source reactance of less than +/-0.01 Ohm. This permitted very small variations in resonant length to show up with normal graphing means. To encompass the widest range of diameters in the smallest span of runs, I used a semi-logarithmic progression of diameters: 0.0843, 0.2666, 0.8431, 2.6660, and 8.4306 inches. Remember that the point of this exercise is numeric: therefore, outputs will be recorded to more decimal laces than within a practical modeling exercise.
Segments  Length/        Ratio of Segment Length to Wire Diameter
          Segment"  0.0843    0.2666    0.8431    2.6660    8.4306
10        40.00     474.50    150.04    47.45     15.00     4.75
20        20.00     237.25     75.02    23.73      7.50     2.37
30        13.33     158.17     50.01    15.82      5.00     1.58
40        10.00     118.62     37.51    11.86      3.75     1.19
As is evident, segment lengths and wire diameters were selected based on a wavelength at 14.0 MHz, 843.0611 inches. The smallest wire diameter is close to the diameter of #12 AWG copper wire (0.0808").

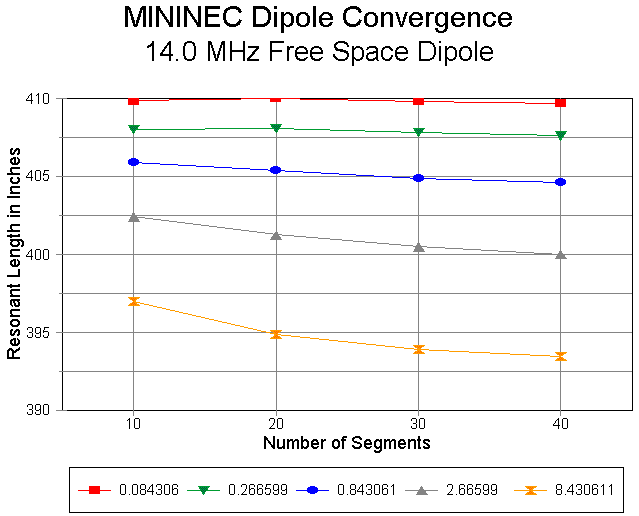
MININEC results are entirely unexceptional. As the dipole diameter increases, the rate of decrease in resonant length with increasing segmentation is greater. However, the largest single change in value occurs between segmentation densities of 10 and 20 per half-wavelength. For the thinnest wire, the difference between the least and most segmented wires is a little over 0.3" in length, while for the fattest wire, the difference is a bit over 3.5" in length.
The line for the 0.84306" diameter wire is virtually linear between segmentation densities of 10 and 40. Lines for thinner wires show an upward trend between densities of 10 and 20, while lines for fatter wires show a downward trend in the same region. Nonetheless, the variation from linearity for the 100:1 range of diameters is quite small. Moreover, the curve for the fattest wire, even though it exceeds the limitation of MININEC for diameter to segment length, shows no radical departure from the general trends.
For this and NEC tests, similar runs were made using wires with some material loss (aluminum). No detectable difference in the trends was noted, so no further reference to them is needed here.
The version of MININEC used (3.13) is uncorrected for the 0.5% frequency shift relative to NEC-2 and NEC-4. Frequency correction would have changed the absolute values of resonant dipole length, but not the trends recorded on the graph.
So far, our investigation has made a colorful graph, but otherwise has been seemingly devoid of interest. It acquires interest only as we compare it with NEC.
Segments  Length/        Ratio of Segment Length to Wire Diameter
          Segment"  0.0843    0.2666    0.8431    2.6660    8.4306
11        36.36     431.29    136.38    43.13     13.64     4.31
21        19.05     225.96     71.46    22.60      7.15     2.26
31        12.90     153.01     48.39    15.30      4.84     1.53
41         9.76     115.77     36.61    11.58      3.66     1.16
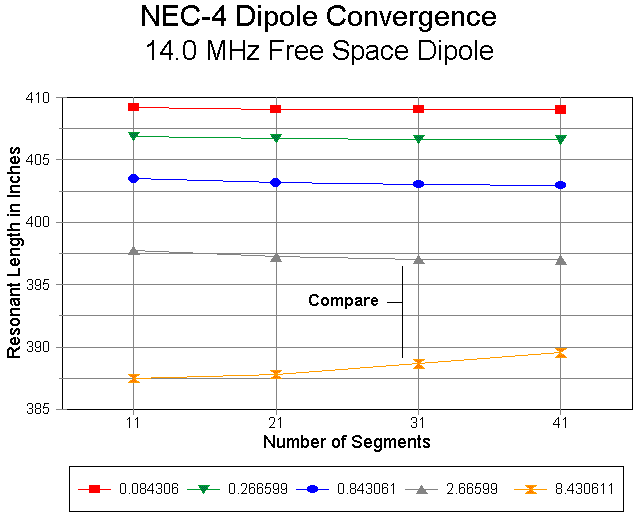
The corresponding graph of NEC-4 runs with a free space dipole of lossless wire at 14.0 MHz yields some interest results, if we look closely.

For all but the fattest wire, the curves are very well behaved. There is only 0.2" difference between the shortest and longest resonant dipoles for the thinnest wire and less than 0.8" difference for a wire over 2.5" in diameter. These figures are more tightly grouped than the corresponding figures for MININEC.
However, if we examine the curve for the fattest wire, its behavior should arouse some curiosity. The curve is at every point the opposite of the curves for the other wire diameters. This behavior is not a function of having passed a certain program limit, since only the highest level of segmentation density surpasses the limit we set for MININEC. Moreover, the rate of change for the fattest wire is nearly three times the rate for the next size lower.
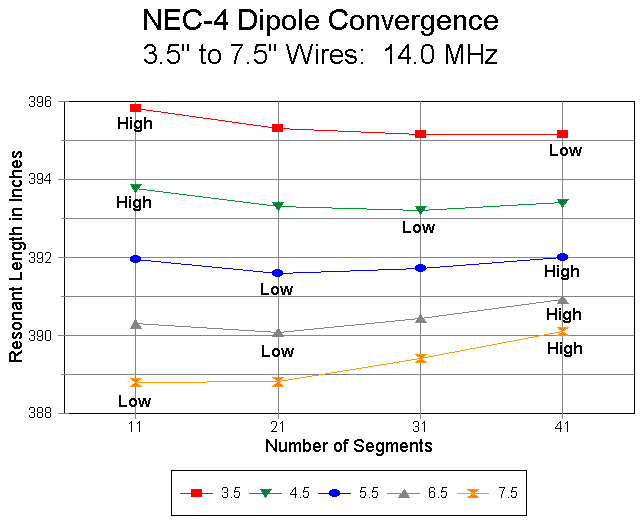
Somewhere between the two largest diameters explored in this general test, the NEC-4 curves changed direction. The nature of the change called for more detailed modeling of intermediate values. So I checked wire diamters between 3.0" and 7.5" in diameter. Some key results for the x.5" values are shown below.

The graph of intermediate values of wire diameter shows how the curvature changes. The curves show that for any wire diameter, the downward trend typifying thin wire dipoles is only temporary. With increasing segmentation such that the wire diameter grows closer to the segment length. there is a relationship that yields the lowest resonant dipole length. This value is in the vicinity of 0.3 for the ratio of diameter to segment length. For both higher and lower values of the ratio, the resonant length tends to increase.
The results of this sequence of models can be replicated at any frequency by scaling both the length and the diameter of the wire along with the frequency. Runs made at 28 MHz with wires of half the diameters resonated within limits with exactly half the length of those used in the 14 MHz test. The ratio of segment length to diameter remained the same. The behavior of the curves is endemic to NEC-4.
The result has some implications for convergence testing with relatively fat wires. The fatter the wire, the less applicable the convergence test. First, increasing the number of segments per half-wavelength more quickly approaches the implicit length-to-diameter limit of the program. Second, the rate of rise in resonant length for the fattest wires suggests that convergence will not be obtained in some cases.
Despite these results, nothing peculiar arises with respect to either reported gain (2.12-2.14 dBi free space gain throughout) or source impedance (total range: 71.82 to 73.16 Ohms resistive). Hence, although the behavior of the NEC-4 curves is quite interesting, little of operational significance emerges from it beyond the realm of convergence testing.
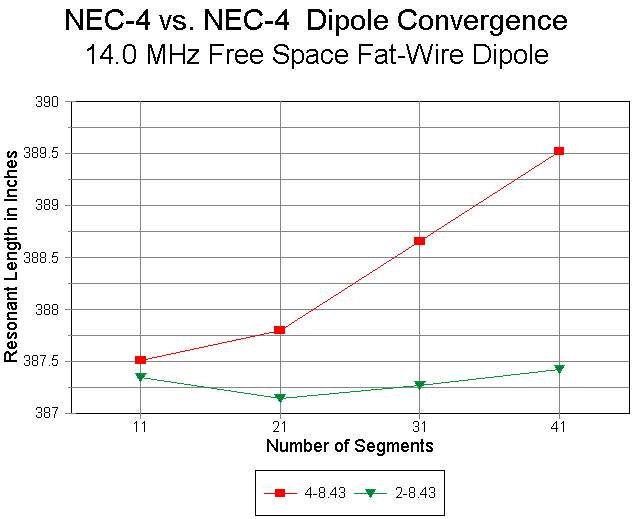
However, for the fattest wire, there is a notable difference in the behavior, as shown in the following graph:

The NEC-4 curve is identical to the one on the general graph, but expanded by the graphing system. The NEC-2 curve, however, resembles most the NEC-4 curve for a wire of 5.5" diameter. In short, with respect to dipoles, NEC- 2 is somewhat better behaved when it comes to fat wires in isolation, possibly by a factor of 1.5. The shortest resonant dipole length appears to occur when the diameter is about 0.4 to 0.5 the segment length.
Updated 3-11-98. © L. B. Cebik, W4RNL. Data may be used for personal purposes, but may not be reproduced for publication in print or any other medium without permission of the author.