 ATUs, Delta, and Losses
Most ATUs used today are L-C networks. The most common configuration is the C-L-C Tee network. However, L-C-L Tees and C- L-C PIs are in use, as are SPC and Ultimate Transmatch designs. Loss figures can be calculated for all such networks.
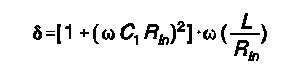
Delta: The old material that contributes to determining ATU losses appears in Terman's Radio Engineers' Handbook (McGraw-Hill, 1943), pages 210-215. Based predominantly on work done in the 1930s by W.I. Everitt, Terman's analysis of classic impedance-matching networks is still referenced by current handbooks. The relevant part for considering ATU losses is the term, delta, which is a justifiably simplified measure of power dissipation in networks. For any impedance matching network, the primary power dissipation culprit is the inductance, and inductor losses can be calculated.
The efficiency of L-C networks is dependent upon the impedance transformation ratio and the phase shift. PI networks and L-C-L Tees generally exhibit a large angle of phase retardation, while the C-L-C Tee circuit shows a large angle of phase advance. In contrast, simple L-networks show small angles of phase advance or retardation. Losses increase with increasing transformation ratios and tend to be larger when the phase shift is either very large or vary small. The delta-figure takes both into account. (Note, in some explanations of networks, but not in all, Terman's delta goes under the name of "working Q," "circuit Q," or "network Q.")
The concept of delta has certain limitations. First, it ignores capacitor losses. This is justified for well-designed capacitors at HF and below, but capacitor losses may become significant at the boundary between HF and VHF (about 30 MHz). Second, the loss figure ignores the effects of strays, both capacitive and inductive, within a real ATU, especially one cramped inside a metal case. At 10 meters, the principal L and C in a matching circuit may be composed more of strays than of component values. Third, the technique will assume we know the coil Q in figuring ultimate efficiency and losses. On this score, we mostly guess, but a figure of 100 for good air wound coils is a conservative guess. Good powdered iron core toroids may yield more. Of course, the "suck out" effect of shorted coil turns is also ignored. Moreover, only networks, and not inductively coupled ATUs, are covered.
Within these limits, the Terman-Everitt delta yields a fair estimate of loss and efficiency. As Terman notes,
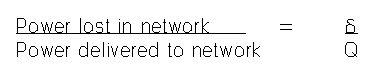
In other, equally approximate terms, network efficiency = 1 - delta/Q. (Multiply this figure times 100 for a percentage value of efficiency).
Now if we only knew how to calculate delta, the rest would be simple. Terman provides graphs for estimating delta. Each type of network requires its own calculation, and it can be a bit tedious to calculate delta for several combinations of component settings. However, Brian Egan, ZL1LE, has derived equations for delta- calculations and added them to his program TUNER.BAS. This versatile program is now included in the collection of programs called HAMCALC, made available by George Murphy. (Contact George Murphy, VE3ERP, 77 McKenzie Street, Orillia, Ontario L3V 6A6, Canada. The software is free and can be distributed. However, to cover the costs of disks and Canadian postage, Murph asks a donation of $5.00. He donates the excess over his disk and mailing costs to the amateur radio program of the Canadian National Institute for the Blind.)
Among the networks for which ZL1LE includes calculations are PIs, C-L-C Tees, SPCs, Ultimates, and L-C-L Tees. By running the program through a selection of values, one can learn the trends of tuning that will minimize losses. Operationally, that is the best we can hope for with a fixed set of impedance conditions presented by the transmission line from the antenna and with ATU components that we cannot modify, that is, with a coil whose Q we cannot improve. From the general relationship of power lost to power delivered, it is clear that we always want to tune for minimum delta.
For CLC T networks, a more complete analysis of losses (or efficiency) appeared in July, 1997, QEX, by Kevin Schmidt, W9CF. In fact, ZL1LE has included Schmidt calculations for this network in his suite of programs, so that you can not only calculate network values for a given match, but also calculate the efficiency of the coupling. Delta turns out to be a good approximation of Schmidt losses for networks with coil Qs above 50.
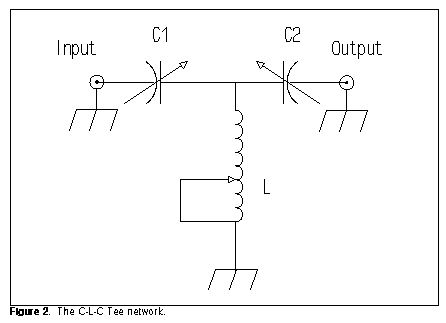
As a preliminary sample, consider a CLC T network of the kind so common in commercial tuners. With an input impedance of 50 ohms resistive and a sample load impedance of 400 + j100 ohms (SWR=8.53:1) at 3.5 MHz, calculations give a maximum transmitter end C1 of 343.7 pF. Using various values of C1 (depending on the components in the tuner we have), we can find the following table of values. Efficiencies are calculated by Schmidt means and delta values by Terman means. A more detailed analysis of CLC networks appears below, along with Figure 2 to make clearer the components C1, C2, and L.
C1             343 pF              250            150
L (Q=250)      6.58 microH         7.16           10.77
C2             305pF               99             51
Efficiency     98.8%               98.1           96.8

C1             343                 250            150
L (Q=100)      6.46                7.15           10.82
C2             263                 96             50
Efficiency     97.1                95.4           92.0

Delta          2.7                 4.5            8.0
Note that efficiency is always higher for the coil with the higher Q and also for the lowest value of delta for any given coil Q. Using delta alone to calulate the efficiencies would have given us 98.9 for the Q = 250 case and 97.3 for the Q = 100 case in the first column.
If we work the same problem for 1.8 MHz, we find that the maximum capacitiance for C1 is 668 pF. Let's arbitraily choose 645 pF for this capacitor, but also work the cases where C1 = 250 pf and 150 pF.
C1             645 pF              250            150
L (Q=250)      12.48 microH        24.11          39.35
C2             418 pF              84             50
Efficiency     98.7%               96.2           93.7

C1             645                 250            150
L (Q=100)      12.36               24.26          39.83
C2             393                 82             47
Efficiency     96.9                90.6           84.4

Delta          3.0                 9.4            15.9
Both of the earlier trends are repeated: efficiency is highest with the highest coil Q and the lowest value of delta. Delta remains a very close approximation of losses (or, in Schmidt terms, efficiency). Note, however, the range of values needed to achieve the highest levels of efficiency.
I ran TUNER.BAS through a number of exercises using different types of networks, and here are some results for some configurations. I chose 10.1 MHz, because I was working on a network problem for that band. To standardize the tests, I chose the following load conditions for each network: 150 ± j0 ohms, 150 + 100 ohms, and 150 - j100 ohms. Looking at a straight 3:1 SWR purely resistive load is a good beginning point, while exploring the network with both capacitive and inductive reactances indicates limitations of the network with certain types of loads. This test is limited, since a higher delta at a 3:1 impedance transformation ratio is not indicative of the network's overall capability. Some networks are more efficient with lower transformation ratios, while others grow more efficient as the transformation ratio increases.
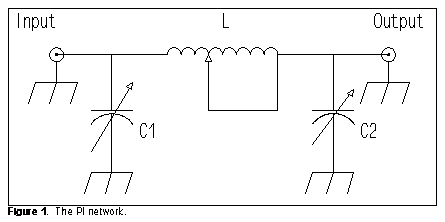
PIs: This familiar low-pass network configuration appears in Figure 1.
For those interested, the Egan equation for delta for a PI network (where omega = 2piF wherever it occurs) is the following:
Here is a small table of results for 10.1 MHz:
Input = 50 ohms  Output = 150 ± j0 ohms  Maximum permitted L = 1.365 µH
       L  1.364     C1  172      C2  179      delta  2.2
or        1.364         192          185             2.5
       L  1.2       C1   36      C2  150      delta  1.5
       L  1.15      C1   15      C2  149      delta  1.5

Input = 50 ohms  Output = 150 + j100 ohms  Maximum permitted L = 1.640 µH
       L  1.639     C1  140      C2  197      delta  2.5
       L  1.6       C1   84      C2  187      delta  2.2
       L  1.5       C1   26      C2  182      delta  1.9

Input = 50 ohms  Output = 150 - j100 ohms  Maximum permitted L = 1.640 µH
       L  1.639     C1  140      C2  100      delta  2.5
       L  1.6       C1   84      C2   90      delta  2.2
       L  1.5       C1   26      C2   85      delta  1.9
In all three cases, the lists stop where one of the values approaches the minimum usually obtainable with ordinary components. In this case, a value for C1 lower than about 20 pF is not normal for most ATUs. In many instances, as illustrated by the very first entry, two solutions to the matching problem are possible. After the first entry, only the more promising set of values is shown. PI networks are, within limits, equally capable of handling capacitive and inductive reactances in the load, with the limits of both being related to the range of C2. Notice that efficiencies of 98% are possible within the limits of the method. As Terman notes, increasing the ratio of the impedances to be matched increases the value of delta and decreases efficiency. For example, when the resistive component of the output impedance is 300 ohms, with or without a reactive load, the lowest value of delta is about 2.3. To achieve the highest efficiency possible for any given matching situation, we must use the following rule of thumb:
C-L-C Tees: This most common ATU network configuration appears in Figure 2.
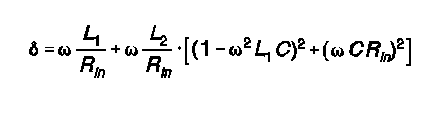
To determine delta, use the Egan equation
Input = 50 ohms   Output = 150 ± j0 ohms     Maximum permitted C1 = 222.9 pF
       C1  222.8    C2  6027     L  1.65      delta  1.4
       C1  222      C2  1468     L  1.59      delta  1.5
       C1  220      C2   992     L  1.56      delta  1.5
       C1  210      C2   362     L  1.43      delta  1.8
       C1  200      C2   262     L  1.39      delta  2.0
Note that although a very low value of delta is theoretically possible, a realistic value of 2.0 or higher is to be expected with common components used in ATUs. As in the case of the PI network, the C-L-C Tee yields higher values of delta as the output impedance is increased. At 6:1 ratio of output-to-input impedance, delta does not go below 2.1 with normal ATU components.
Input = 50 ohms  Output = 150 + j100 ohms  Maximum permitted C1 = 222.9 pF
       C1  222.8    C2  154      L  1.65      delta  1.4
       C1  220      C2  132      L  1.54      delta  1.6
or         220          196         1.85             1.3
       C1  210      C2  110      L  1.43      delta  1.8
or         210          279         2.12             1.2
       C1  200      C2   98      L  1.39      delta  2.0
or         200          396         2.34             1.2
Note in this table that two sets of matching values are possible, even within the range of normal ATU components. One set drives toward maximal efficiency as C1 is decreased, while the other set moves away from the highest efficiency under the same condition. The primary setting to watch, therefore, is that of C2.
Input = 50 ohms  Output = 150 - j100 ohms  Maximum permitted C1 = 172.6 pF
       C1  172.5    C2 91080     L  1.37      delta  2.5
       C1  150      C2   456     L  1.42      delta  3.0
       C1  130      C2   223     L  1.52      delta  3.6
With respect to efficiency, the C-L-C Tee is less effective with
capacitively reactive loads than with inductively reactive loads.
With some load conditions, here a capacitive reactance of 100 ohms
combined with our standard 150-ohms resistive component, a very low
delta will not be possible with normal components. The best we can
do is to keep delta as low as possible by following the common
advice for C-L-C Tee tuners:
However, even with a delta of 3.6 to 4, efficiency with a coil Q of 100 will be in the neighborhood of 96%.
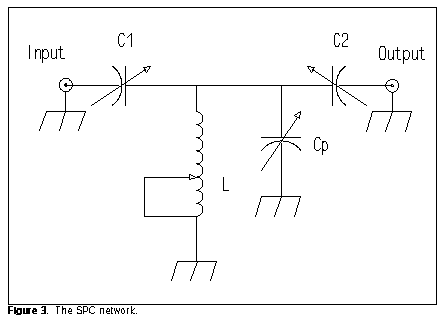
SPC: The SPC (series-parallel capacitance) network is the more general case of which the C-L-C Tee is a specific instance. Note that the C-L-C results from the SPC if we lower the value of the capacitor in parallel with L to zero. Ordinarily, the parallel capacitor is ganged as a dual unit with either C1 or C2. The requirement for a high-voltage dual-section capacitor has limited commercial production of SPC tuners. Figure 3 shows the more common configuration, with Cp and C2 ganged as equal-value units.
The SPC departs from the C-L-C Tee in two significant operational characteristics. First, the actual values required for a given impedance transformation will differ. Second, the SPC tends to tune much more sharply. I recommend the use of verniers on the capacitors for ease of tuning. However, the equation for determining delta for the SPC is the same as that given for the C- L-C Tee.
Input = 50 ohms  Output = 150 ± j0 ohms    Maximum permitted C1 = 222.9 pF
       C1  222.8    C2  6027     L  0.04      delta 58.8
       C1  210      C2   362     L  0.64      delta  4.7
       C1  180      C2   176     L  0.69      delta  4.6
       C1  170      C2   152     L  0.75      delta  4.7

Input = 50 ohms  Output = 150 + j100 ohms  Maximum permitted C1 = 222.9 pF
       C1  222.8    C2  154      L  0.82      delta  2.9
       C1  220      C2  137      L  0.85      delta  2.8
       C1  215      C2  118      L  0.87      delta  2.9

Input = 5 0ohms  Output = 150 - j100 ohms  Maximum permitted C1 = 172.6 pF
       C1  172.5    C2 91080     L  0.01      delta 1256
       C1  140      C2  305      L  0.52      delta  9.1
       C1  120      C2  172      L  0.76      delta  8.2
       C1  110      C2  136      L  0.88      delta  8.3
The SPC tuner improves the harmonic rejection characteristics of the C-L-C Tee (which is inherently a high-pass filter), but apparently at the cost of lower efficiency. All three tables show the values surrounding the lowest value for delta obtainable under the given load conditions. The SPC appears to do better with inductive loads than with purely resistive transformations or capacitive loads. The value of delta increases for resistive and inductive loads as the ratio of output-to-input impedance increases, but shows a slight decrease for capacitive loads at higher ratios. Because tuning points are quite specific, no general rule of thumb is possible for the SPC.
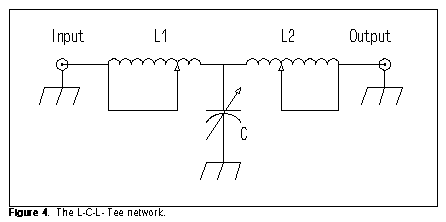
L-C-L Tees: The L-C-L Tee, shown in Figure 4, has suffered from neglect until recent years. It is a natural low-pass filter, like the C-L-C PI shown earlier. However, whereas the intermediate impedance of the PI is lower than either the input or output impedances, the intermediate impedance of the L-C-L Tee is higher than either the input or output impedances. This results in higher voltages and lower currents at the junction of the three components.
Determining delta for the L-C-L Tee requires attention to both inductors, which for simplicity are assumed to have the same Q in the following Egan equation:
Input = 50 ohms  Output = 150 ± j0 ohms    Minimum permitted L1 = 1.114 µH
       L1  1.115    L2  0.07     C  152       delta  1.4
       L1  1.12     L2  0.20     C  157       delta  1.5
       L1  1.20     L2  0.77     C  176       delta  1.8

Input = 50 ohms  Output = 150 + j100 ohms  Minimum permitted L1 = 1.438 µH
       L1  1.439    L2  0.01     C  181       delta  1.8
       L1  1.50     L2  0.16     C  180       delta  2.0
       L1  2.00     L2  1.30     C  159       delta  3.1

Input = 50 ohms  Output = 150 - j100 ohms  Minimum permitted L1 = 1.114 µH
       L1  1.115    L2  1.51     C  145       delta  2.1
       L1  1.12     L2  1.38     C  140       delta  2.0
       L1  1.14     L2  1.16     C  129       delta  1.9
       L1  1.43     L2  0.02     C   85       delta  1.8
Despite the use of two theoretically lossy inductances in the L-C-L Tee, it maintains low values of delta over a wide range of load conditions and transformation settings. Delta climbs more rapidly with inductive loads than with capacitive loads away from optimal settings. The operative rule of thumb for maximum efficiency is this:
This operative rule holds true at higher ratios of output-to-input impedance, even though values of delta increase at those ratios. L-C-L Tees are subject to losses from circulating currents in the shorted turns of either switched or rotary solenoid or toroidal coils, losses that the value of delta cannot take into account. Therefore, construction of this network requires special care.
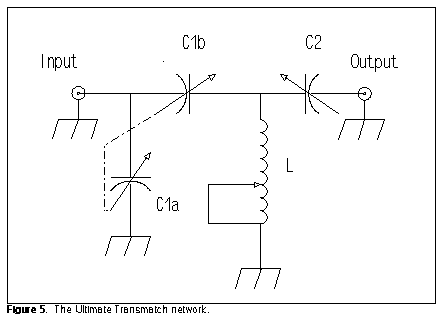
Ultimate Transmatch: Lew McCoy's Ultimate Transmatch (UT) is an interesting variation on the C-L-C Tee. It places a dual capacitor at the input of the network, one section in series with the signal path, the other section to ground. Figure 4 shows the general outline of the network.
Calculating delta for the UT design requires the following Egan equation:
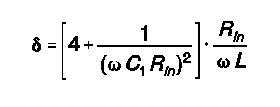
Input = 50 ohms Output = 150 ± j0 ohms  Maximum permitted C1 = 750 pF per section
       C1  749      C2   168     L  0.57      delta  5.8
       C1  600      C2   161     L  0.68      delta  5.0
       C1  400      C2   143     L  0.90      delta  4.1
       C1  250      C2   113     L  1.17      delta  3.8

Input = 50 ohms Output = 150 + j100 ohms Maximum permitted C1 = 750 pF per section
       C1  749      C2   81      L  0.57      delta  5.8
       C1  400      C2   75      L  0.90      delta  4.1
       C1  250      C2   66      L  1.17      delta  3.8

Input = 50 ohms Output = 150 - j100 ohms Maximum permitted C1 = 546 pF per section
       C1  545      C2 >350K     L  0.73      delta  4.7
       C1  300      C2  615      L  1.06      delta  3.8
       C1  250      C2  400      L  1.17      delta  3.8
       C1  200      C2  256      L  1.30      delta  3.9
Like other series-capacitance designs, the UT appears most effective with purely resistive and inductive loads: Required values for a match fall easily within the ranges of normal components just as the network approaches maximum efficiency. (If C1 is lowered further in these cases, delta increases.) However, with capacitively reactive loads, maximum efficiency has passed by the time C2 enters the range most normal for ATUs.
Although the values for delta are higher than with some other designs, efficiency remains in the 96% ballpark. In fact, the efficiency of the Ultimate Transmatch appears to increase (at least to some limit) with increases in the ratio of output-to-input impedance. Using a 300-ohms output resistance with either no reactance or 100 ohms of inductive reactance, the UT achieved values of delta in the neighborhood of 2.8, while with 100 ohms of capacitive reactance, delta was about 3.5. The rule of thumb for the UT design is not as simple as with some other designs:
Remember that, for any of the network designs, as the frequency decreases, some of the efficiencies achieved in these 10.1 MHz tables may not be reached, since proportionately greater values of C and L may be needed for the same load conditions. Moreover, switched inductors may not provide the values necessary for highest efficiencies. This limitation is rarely a problem, since the value of delta in most cases "bottoms out" over a fairly wide range. Nonetheless, the rules of thumb continue to apply.
Moreover, remember that these figures are based solely on
losses in the inductor, one assumed to have a Q in the range of
100 or more. Additional losses due to poor components, bad wiring and
switching, stray inductances and capacitances, and coil "suck-out"
are not accounted for by the calculations. If components get warm
or arc under matched conditions at 100 watts, even though the
calculations indicate less than 5% losses, believe your senses.
Then analyze the components and construction of your ATU.
Something other than network choice is very wrong.
First printed in QRP Quarterly, January, 1996. Updated 3-25-98. © L. B. Cebik, W4RNL. Data may be used for personal purposes, but may not be reproduced for publication in print or any other medium without permission of the author.