
 Why 0.707?
Granted, some students are content to memorize the relationship and let matters go. However, some want to get a handle on the relationships between peak and r.m.s. values of voltage and current. When I sense this, here is how I proceed. I turn around the explanation, starting with power and never mention r.m.s. until it is necessary to name the unit of measure. The task is not as easy as it appears. Many ham students have never mastered basic ideas in math and geometry. Therefore, the process of putting together the needed ideas often requires a few time-outs for reviewing or teaching some essential skills.
However, the results are often startling: the exercise of tying together ideas on this topic often triggers repeat performances by the students with more advanced ideas in electronics. Seeing the student consolidate ideas on his or her own produces a feeling of teacher satisfaction that justifies the time and energy of taking the student on a detailed trip through basic ideas in alternating current.
The following notes reflect how I generally proceed, including how I try to lead students around the pitfalls and hazards along the way. Although there is no magic in this step-by-step procedure, it does seem to work. The methods may be usefully adapted to other teaching efforts, both in basic subjects and in more advanced topics for license upgrades.
To be sure the student understands this, use a schematic diagram or a test set-up configured as in Fig. 1. Since it is difficult to work out a test jig that allows both E and I to be equal without serious straining batteries, the schematic is often the best teaching aid, especially if supplemented by numerous sample calculations.
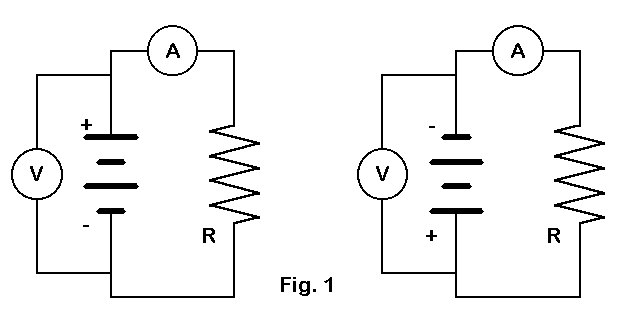
For the DC lesson on Ohm's Law, digital voltmeters and ammeters can help plant the understanding that negative values of voltage and current are also proper for the E to I ratio. Value combinations of -2:-2, -4:-4, and -6:-6 all yield an R of 1 ohm, just as did the positive numbers. The only difference is the direction of electron travel through the meter and resistor.
It is also important to stress that the values read from the meters are the levels of voltage and current at the instant of the reading. Neglecting real-instrument delays, every instantaneous reading represents an equally instantaneous level of voltage and current.
Power, of course, is the rate of energy use. In transferring DC understanding to AC, we need also to be certain the student grasps the relationship of power to work or total energy use. Work is the rate of energy use multiplied by the time of usage. Whether we measure work in watt-seconds, watt-hours, or kilowatt-hours, the total electrical energy used by our circuit in Fig. 1 is reflected by the total heat generated and dissipated by the resistor. The longer we do work at a constant rate, the more energy we use. Ignoring the actual means used to measure house power use, the longer we run the electric heater, the more we pay the power company, which charges us for the total energy we use. If we ran that same heater off of batteries, we would see the same increase in cost by having to buy replacement batteries periodically.
If the time factor is the same for every calculation, then power will be directly proportional to work. For a steady direct current through a constant value resistor with a constant voltage, power will be proportional to work. However, the student needs to get a grasp of the importance of time before approaching AC.
For one thing, the DC-equivalents of AC phenomena depend on averaging
certain values over at least one cycle. For another, energy use and its
rate are also averages over time.
The power formula,
Note that in these formulas, I use the symbols for multiplication and division most familiar to ham students. With calculators and computers, students understand "/" to mean division, but if necessary, use the other division symbol.
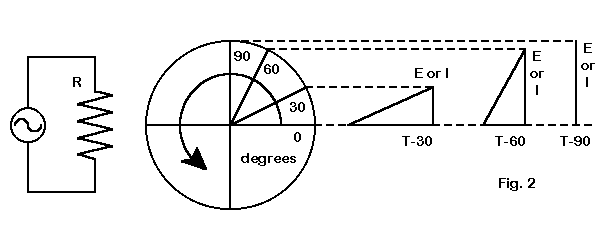
To introduce circular motion, I generally use a hypothetical generator which goes through one electrical cycle for every mechanical cycle. Fig. 2 illustrates how I use the generator. As the generator passes through the time-instant T0, its position vertically is also 0. The voltage and the current available to the load resistor is also 0. As the generator passes through T30, indicating the 30-degree point of travel around the circle, its elevation above 0 is a certain value. Here is where we must introduce just the amount of trigonometry needed to find out how high the arm is.
Whether or not a student has had trigonometry, it is not difficult to
convey the idea that the relationship of the side opposite to an angle of
interest divided by the hypotenuse is a constant for any given angle. Then
we can name the relationship the sine of the angle. Next, we can calculate
the values of voltage for each of the indicated angles by punching out the
sine of the angle on an inexpensive "scientific" calculator. If we let the
hypotenuse of the triangle be 1 for all cases, then
For these introductory examples, it is convenient to let both the hypotenuse of the triangles be 1 and the load resistor be 1 ohm. Numbers other than 1 will obscure the relationship of the sines of angles to the values of voltage and current, as well as to the value of power. When the lesson is over, you can inform the student that he or she has just had his or her first experience with the supposedly advanced concept of "normalized values."
When introducing the idea of the instantaneous voltage or current, I try to use angles of 30 and 60 degrees, avoiding 45 degrees as much as possible. The aim here is to be sure the student is comfortable with circular motion and sines without prematurely including a half-developed notion of r.m.s. in the explanation.
Although Fig. 2 shows only the first quadrant of motion, I generally take examples from all four quadrants. This shows that the values of voltage and current (with a purely resistive load) take both positive and negative values, and that they take them together. Here, we can relate these calculations of instantaneous voltage and current values to the DC measurements we made when reversing the direction of current flow.
In fact, we can now show that Ohm's Law applies to instantaneously
measured or calculated values of AC. At any given point in the path of
motion,
One of the most interesting sets of instantaneous values is the one
produced by doing Ohm's Law at 90 degrees and again at 270 degrees. Since
we let the hypotenuse be 1,
Just here, we can open some questions yet to be answered. Since the peak voltage, current, and power occur at only two points along the entire travel within the generator, they do not alone define the total energy produced by the generator and used by the resistor during an entire cycle. That value must be something less than the peak value. But how much less? Is there a systematic relationship between the peak voltage, current, and power and the total energy generation and use over time? These questions take us to step 3.
Each step in the lesson purposefully ends with some questions to teach by example to students a way of teaching themselves. By noticing details that lead to questions and then by posing good question, the student can guide himself or herself to good answers. Proceed slowly to let the method sink in.
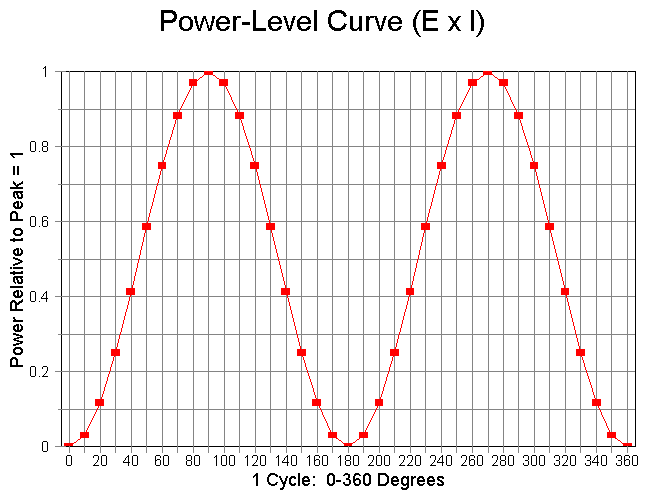
The curve, of course, is simply a sine-squared curve with a maximum value of 1. If you have access to a spreadsheet program, you can produce full-page curves to assist students in working with the next set of ideas. My procedure began with setting up spreadsheet columns for every 5 degrees from 0 to 360 degrees. The next row converts them to radians. (Use @RAD(X) formula on column A and copy it for the remaining columns as a block.) The third row takes the sine of the angle (@sin(X)) (using the same do-it-once-and-block-copy procedure). Row four uses the formula "A3 * A3" (with block copy for the remainder) to produce the values for a sine- squared curve. Graphing the results produces an accurate curve, labeled to taste. The curves shown here are flattened to take less vertical space, but spreadsheet programs with excellent graphing ability (such as Quattro Pro 7.0 used here) will proved full 8.5" by 11" graphs with fine resolution.
The curve is very useful. First, it shows the variations in instantaneous power over time. The student can now see that the actual energy generated and used will be a function of time as he or she imagines the curve repeated over and over through many cycles. The resistor is going to warm up and reach a pretty constant temperature with AC, just as it did with DC.
Discovering how much energy is used per unit of time will require more than an instantaneous readout. It will require that we average the power of the cycle, meaning a time period of 360 degrees. Thinking of degrees as time units is important in the understanding of AC, and many students never catch on to this fundamental notion. If it helps, you can convert each degree (or five degrees) into a period of milliseconds. However, to keep the student from thinking these ideas apply only to American house current, use several AC frequencies in the power range. At 60 Hz, a cycle takes about 16.7 milliseconds or about 46 microseconds per degree. In Europe, where 50 Hz is fairly standard, a cycle takes 20 milliseconds at about 55 microseconds per degree. That is fast, but finite.
Returning to Fig. 3, we can by visual inspection alone see that the 0.5 line represents the average of all the values on the curve. The student should draw a line across the page on this 0.5 dotted line to emphasize it. The area inside the peaks above the 0.5 line equals the area outside the peaks and below the 0.5 line: the missing power and the present power are the same. Cutting up a graph to show this can take any distrust out of the student's inspection. Of course, rudimentary integration techniques would confirm the visual findings, but we shall not presume of the student any math we cannot easily teach along the way.
The result of this exercise is the convincing confirmation of the fact
that the average power is half the peak power. Otherwise expressed.
Before we leave Fig. 3 behind, let's take one more look at it. There are four points on the graph where the instantaneous AC power equals the average AC power. Those are the points where the graph of instantaneous power crosses the 0.5 horizontal line. Along the time or 0-to-360-degree axis, those points are 45, 135, 225, and 315 degrees. Looking back at Fig. 2, we can see that these points are the half-way points along the arc from 0 to 90 degrees, from 90 to 180 degrees, etc. Whether we look at the circular diagram or the power curve, we can conclude that the power is below the 45-degree point for half the time and above it for half the time.
We now have a fairly clear picture of electrical energy doing work, whether that electrical energy is AC or DC. Doing the same work indicates an equivalence between the two forms of electrical energy.
However, we still have a question or two left over. If the DC power equivalent of AC power is the average AC power or half the peak AC power, what will be the values of AC voltage and current relative to peak voltage and current that will be equivalent to their DC counterparts?
1. Remembering that the peak power is 1 watt produced by a peak
voltage of 1 volt and a peak current of 1 amp, we can ask what voltage and
current are needed to produce a current equal to half the peak power. We
are specifically looking for a voltage and current with the same numeric
value. Other voltage and current values that produce the same power can be
derived with a single constant, k, such that
Therefore, Edc-equiv = Idc-equiv for the problem at hand. We are seeking a numeric value which, when multiplied by itself, produces the desired power value. This, of course, is simply the square root of the power value. However, some students may well have lost track of the concept of square roots and require an explanation of this order.
The DC-equivalent voltage and current are both the square root of the
average or dc-equivalent power. We might formalize this as
Of course, from our discussion of the basic generator and resistor circuit, both the voltage and current may be negative, but only at the same time.

2. The graph of the instantaneous values of voltage and current form sine waves, as shown in Fig. 4. It is possible to compare this graph with Fig. 3 to derive some valuable data, but combining graphs can make the comparison easier. Fig. 5 combines the voltage-current sine wave with the graph of instantaneous values of power using separate axes, one on the left, the other on the right. Fig. 6 takes a different approach. If the student understands that a negative voltage times a negative current yields a positive power, then we can graph the absolute values of the voltage or current to produce the graph in Fig. 6. To graph absolute values on a spread sheet, simply add a new line in column A, using the @ABS(X) function. Then, block copy the new line in A for all columns from 0 to 360 degrees.
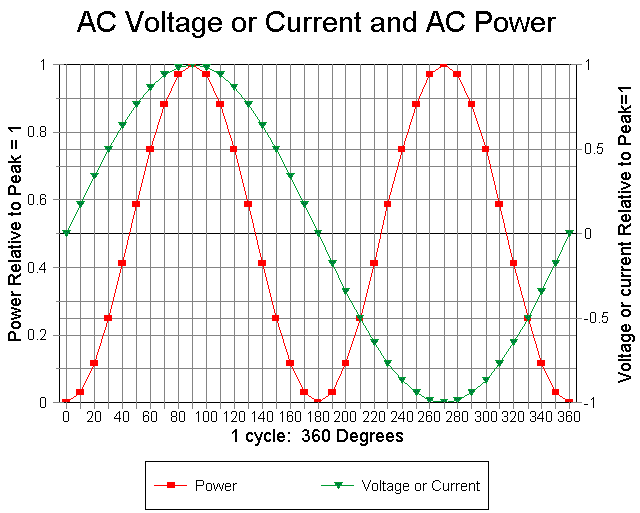
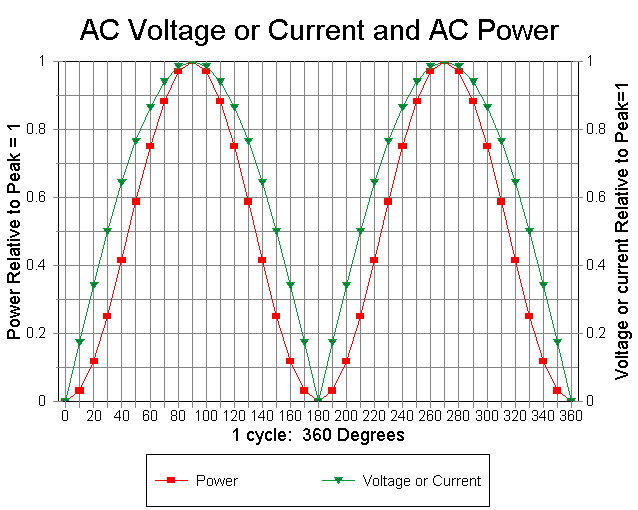
Whichever graphing system you use, call attention to the number of degrees at which the power crosses the 0.5 horizontal line. Then ask what the voltage and current are at these degree points. You can read approximate values from the graph at the 45, 135, 225, and 315 degree points: a little over 0.7.
Taking the sine of any of these points produces a value of 0.707 for 45 and 135 degrees and -0.707 for 225 and 315 degrees. For a power of 0.5 Ppk, the resultant voltage and current are 0.707 Epk and 0.707 Ipk, respectively.
Fig. 6 also demonstrates that except for the 0 and 1 points on the graph, both the voltage and the current must have values greater than the numerical value of the power (when voltage and current are equal, before multiplying one by k and the other by 1/k).
Finally, the graph demonstrates that the value of voltage or current that is 0.707 times the peak value of each represents the same time division line as the 0.5 peak power point. That is, for half the time of each cycle, the value of voltage, current, or power is less than the indicated value and for half the time of each cycle, the value of voltage, current, or power is more than the indicated value.
The graphic ideas dovetail with the straight arithmetic ideas perfectly. That is the goal of teaching the same lesson from more than one point of view. Some students learn best by seeing the calculations; others learn best from examining the graphs. Some will even combine ideas from the two perspectives before catching on. Do not rely on mere repetition.
What then is the value of the peak voltage and current relative to the
DC equivalent values. since 1 DC equivalent volt or amp = 0.707 the peak
voltage or current, the peak voltage or current must equal the DC
equivalent voltage or current divided by 0.707, or
At this point, you can introduce the student to the magic of the square root of 2. 1 divided by 0.707 = 1.414 and vice versa. 0.707 equals half the square root of 2 or 1.414 / 2. If your students are interested, you may wish to return to the basic ideas of trigonometry and geometry to trace the use of the square root of 2 in connection with the sides and the hypotenuse of right triangles. Familiarity with these relationships will pay dividends to the student in his or her later study of electronics.
Or you may just give as a memory exercise the conventional formulas:
Let us try another method of "averaging." First, take the square of each instantaneous value. Next, add up all the squares. Third, take the average (or the mean) of all the squares by dividing the total of the squares by the number of instantaneous values. Finally, take the square root of the result.
This "root mean square" (r.m.s.) method of taking the square root of the mean of the squares of all the values of the voltage or current under the curve, ranging from 0 to 1, yields a value identical to the DC equivalent value of voltage and current. We can approximate the process by checking all values at 5-degree intervals. The result, using 19 data points (like the result of using all possible instantaneous values), is 0.707 of the peak value. The full r.m.s. calculation simply expands our earlier arithmetic derivation of DC equivalent values.
From this fact, Edc-equiv and Idc-equiv get their common names: Erms and
Irms, where "rms" means "root mean square." Hence, we may take the final
step of relabeling earlier formulas:
The process of thoroughly teaching r.m.s. values of AC requires
patience. It may not be for every new amateur student. It requires
helpful analogies and lots of teacher personality. But, when a student
really catches on, the effect is rewarding to teacher and student alike.
From Proceedings of the 1995 National ARRL Education Workshop, (Newington: ARRL, 1995), pp. 33-40 © L. B. Cebik, W4RNL. Data may be used for personal purposes, but may not be reproduced for publication in print or any other medium without permission of the author.