


Do not be fooled. Transmission lines--or feeders, feedlines, cable, etc.--are not ordinary wire. They have conductors, but so too do capacitors, coils, switches, etc. But like all those components, transmission lines use conductors to do a job--actually a lot of jobs.
So I shall not tell you anything new about transmission lines. It is all in the books. What I want to do is simply reorganize all that information so that we have some good ways to look at transmission lines. Once we have that fixed in our heads, transmission lines will never be mysterious again. In fact, they will become our friends, if not the love of our lives.
We shall along the way note some handy and some not-so-handy formulas for calculating stuff. You should be familiar with what they are trying to tell us, but at the same time, you should not have to fill pages with calculator outputs. Let two programs do that. One is HAMCALC (Version 32 or higher) from VE3ERP has a number of programs to do all the work for you. Another handy program is TLA, from N6BV of ARRL. We shall note how to use these cheap but rich resources along the way.
Oddly, the majority of hams I know cannot tell me how long their transmission line is within 6 inches. This vacuum proves that no one ever told them that measuring is the first step to making friends with the line.
Obviously, the best time to measure a transmission line is before you install it. Include the connectors--they are part of the overall length.
Why know the length? First, the obvious: the line has to reach from your shack to the antenna. Second reason: if it breaks or goes bad, you need to know how much replacement to buy.
Third reason: there is a lot that just knowing the length will tell us--when we are ready to learn it and need to know it. Every other piece of information about transmission lines gets used some of the time, but length gets used all the time. So always know how long every piece of transmission line is in your system. Short pieces: measure to some fraction of an inch. Long pieces, measure within a couple of inches or so.
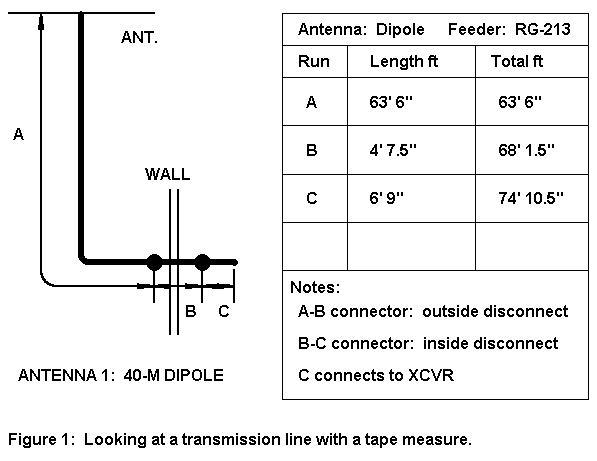
Now make a sketch and a chart, as suggested in Figure 1. Note that every sub-length is listed, as well as totals for a given run between points. Revise the chart whenever you make any changes in the feedline system. Store this chart where you keep all of the instructions and other plans for your station equipment, but keep it handy for reference.
                                   Typical Feeder Values

1.  Coaxial Cables

RG #           Belden #       Zo          Velocity    Loss in dB
                              Ohms        Factor      per 100' @ 3.5 MHz

RG-58A         8529           50 -j1.29   0.66        0.762
RG-59A         8241           75 -j1.81   0.66        0.711
RG-8X          9258           50 -j1.03   0.78        0.511
RG-8A          8237           50 -j0.60   0.66        0.351
RG-213         8267           50 -j0.60   0.66        0.351
RG-8 (foam)    8214           52 -j0.60   0.78        0.289
               9913           50 -j0.52   0.84        0.242
               9086           50 -j0.52   0.84        0.242
RG-11A         8267           75 -j0.89   0.66        0.351
RG-17A                        50 -j0.24   0.66        0.140
RG-218                        50 -j0.24   0.66        0.140

2.  Hardlines (solid jacket coaxial cables)

Type                          Zo          Velocity    Loss in dB
                              Ohms        Factor      per 100' @ 3.5 MHz

1/2" hardline                 50 -j0.23   0.81        0.111
1/2" hardline                 75 -j0.41   0.81        0.132
3/4" hardline                 50 -j0.15   0.81        0.074
3/4" hardline                 75 -j0.31   0.81        0.098

3.  Parallel 2-wire feedline

Type                          Zo          Velocity    Loss in dB
                              Ohms        Factor      per 100' @ 3.5 MHz

300-ohm tubular xmt           300-j2.14   0.80        0.173
450-ohm "window" ladder       450-j2.16   0.95        0.098
600-ohm open wire             600-j0.95   0.97        0.032
                                                      from TLA by N6BV

Table 1.  Some characteristics of typical transmission lines.
1. Velocity Factor (VF): Look at Table 1, which provides some significant data on a few common types of feeders, both coaxial and parallel. For the moment, we are interested only in the column labeled "velocity factor." This column tells us how long that a length of the feeder is in terms of its relationship to a wavelength of RF energy. Since the example in Figure 1 uses RG-213, we need only a glance at the table to see that its velocity factor is 0.66.
VF tells us that any wavelength of energy in the cable at any frequency is only 0.66 as long as the same wavelength in free space. Conversely, the effective length of the cable is simply its physical length divided by VF. 74.875' (or 22.82 m) divided by 0.66 is about 113.45' (34.58 m) long.
2. A Wavelength at a Desired Frequency: Since a free space wavelength at 1 MHz is about 299.8 m or 983.6' long, we can find the length of a wave at any frequency in MHz by dividing the base number by the desired frequency. Let's say that our 40 meter dipole is cut for 7.15 MHz. 983.6 (299.8 m) divided by 7.15 yields 137.56' (41.93 m).
3. Converting to Degrees: To change the result into electrical degrees, just divide the effective length from step 1. by the length of a wavelength in step 2. and multiply by 360 (the number of degrees in one cycle). So 113.45/137.56 (34.58/41.93) equals 0.825, times 360 equals 296.9 degrees.
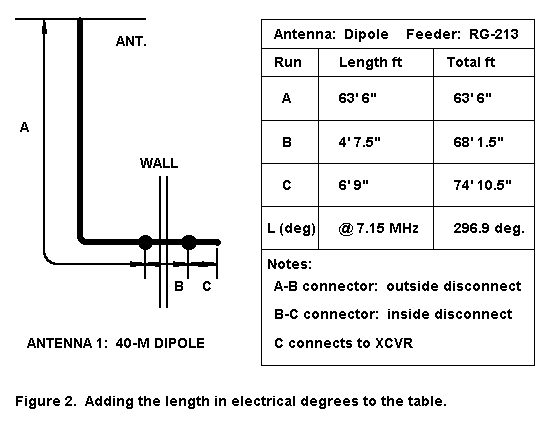
Let's enter this data in our record chart, as in Figure 2. For the moment, this is for curiosity, but soon we shall make use of the information.
For our notebooks, we can combine the 3 steps into one big formula. The only difference between the two version is that for a physical length in feet, we divide 360 by 983.6 to get a constant of 0.366; while for physical lengths in meters, we divide 360 by 299.8 to get a constant of 1.20.

Of course, if we know the electrical length of a feeder and its velocity factor and frequency of operation, we can turn these formulas around to get the physical length:

where K = 1.20 for a result in meters and K = 0.366 for a result in feet. Do not lose this, because it will come in handy later. If you do lose it, you can get the results from one or more of the programs on HAMCALC.
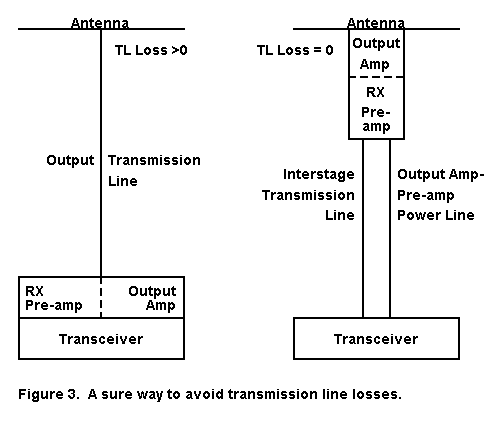
If this scheme is impractical for your situation, then you must resign yourself to using feedlines from your transmitter-output/receiver-input to your antenna. With that act of resignation comes a job: understanding feeder line losses and reducing them to a practical minimum.
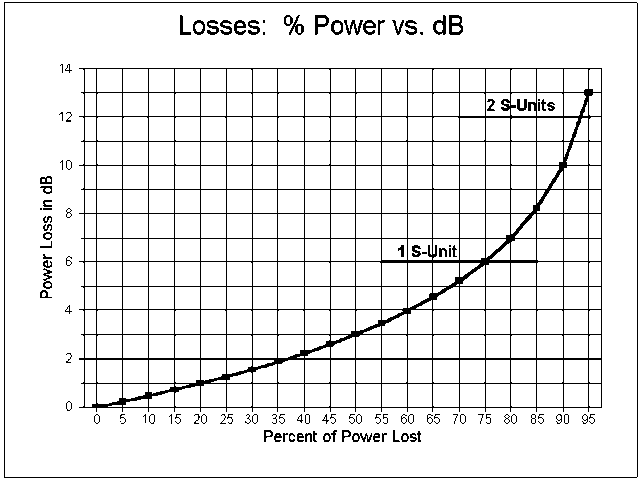
The first step in the process is understanding what power loss means in practical terms. Figure 4 is designed to help. It graphs actual power loss with the loss registered in decibels (dB). If we arbitrarily let 6 dB equal 1 S-unit, then you have to lose about 75% of your power before your signal goes down by 1 of those S-units.
All of this is fine for the QRO operator, who has power to spare. However, QRP operators often work on the differences between no registration on the S-meter and a faint tick of the needle, that is, in the 1 dB differential between no signal and something that can be heard and copied. Even though 1 dB represents about a 20% power loss, that 20% can be composed of lots of little losses that add up. Hence, it pays--within certain practical limits--to minimize every potential power loss.
Let's peek back at Table 1, our list of typical feeders. Starting with the coaxial cables, we notice that the fatter the cable, the lower the loss, for any given characteristic impedance (Zo). Hence, if you want to use coaxial cable, try RG-218 or one of the hardlines.
The other option is to use one of the parallel feedlines, which are quite light and have low losses. Since their Zos are not the semi-standard 50 ohms, you will need an ATU to match whatever impedance the line presents to your transceiver.
Notice that the loss figures are given for perfectly matched systems at 3.5 MHz and use 100' of line. Now, the line length calculations is very linear. Double the length of line and you lose twice as much power; halve the line length and lose half the power.
Suppose we freeze the line length at 100' and change frequency or change SWR. What happens? We are told that the losses increase with frequency and with SWR, but by how much?
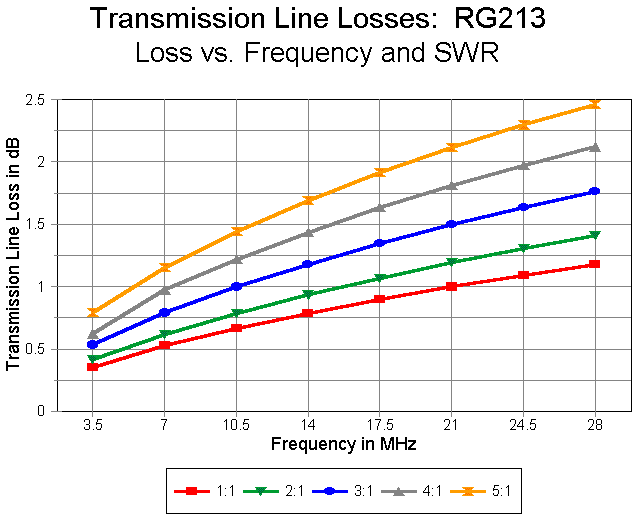
Figure 5 shows the losses from 80 to 10 meters for RG-213 for SWR ranging from 1:1 to 5:1. This will give you an idea of the rate of loss increase from both frequency and from SWR for a standard 0.4" diameter coaxial cable.
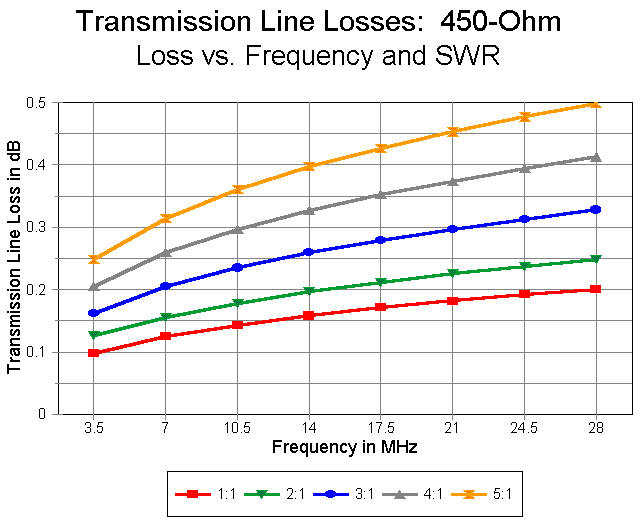
Compare Figure 5 with Figure 6. The second graph is for standard 450- ohm plastic covered window line over the same frequency spread and SWR range. Incidentally, 5:1 is about the SWR for a low-hanging dipole (80-90 ohms feedpoint impedance). First, notice that the shape of the curves are quite similar to those for the coax. This means you can use these curves to extrapolate reasonable loss values from other cables you use, knowing the matched loss value.
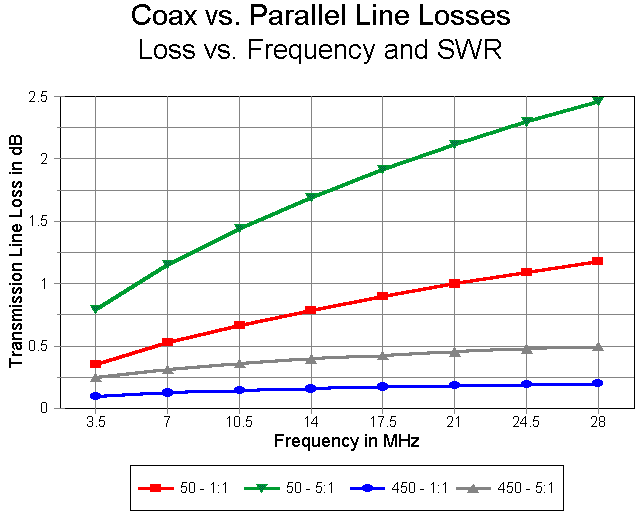
However, let's not neglect the loss figures on the vertical axis of the graph. They are quite different for the two types of cables. Figure 7 shows the 1:1 and 5:1 SWR figures for the two cables. Note that the parallel transmission line has a lower loss per 100' at a 5:1 SWR than RG- 213 with a 1:1 match. In fact, the parallel transmission line losses would be less, even with a 10:1 SWR (except under certain rare conditions that your ATU could not handle anyway). Referring back to Table 1, only hardline rivals parallel transmission line for low losses, but with a large penalty in handling difficulty and weight.
Lowest-loss recommendations:
1. Use parallel feedline unless physical situations dictate otherwise.
2. Use the shortest feedline possible (consistent with solid installation).
3. Do not throw away expensive coax recently installed: save any change- over for the next time lines get old.
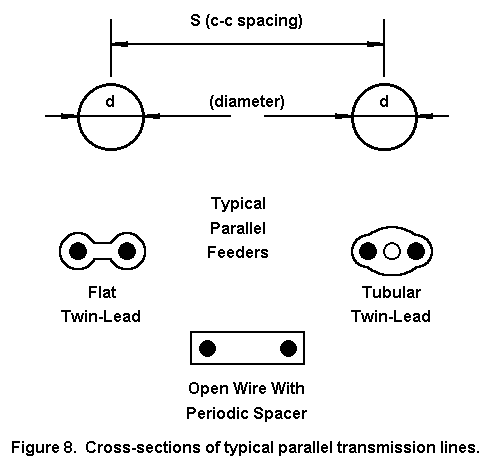
Figure 8 shows a cross section of some common parallel transmission lines. The basic idea is to keep the two lines exactly parallel for their entire length. So we use spacers or some windowed or closed insulating material to lock the wires in place.
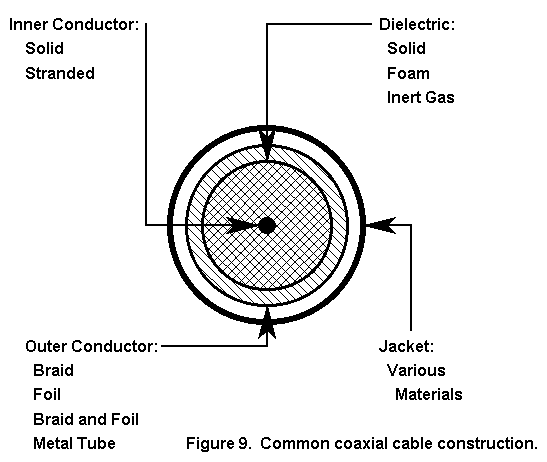
Figure 9 shows some common coaxial cable construction, where the two wires are not identical. Rather, there is a center conductor, solid or stranded, and a concentric outer conductor. What is in between can be a solid or foam dielectric, air, or an inert gas. The outer conductor can be a braid or solid. Needless to say, a stranded center conductor with a braid is more flexible than the same size coax with a solid conductor and a solid outer conductor.
Note that as long as I am treating the cable as a transmission line, I try never to use the word "shield." Too, the outer jacket serves no electrical purpose, but may serve both physical and chemical purposes. All jackets hold the outer conductor tightly in place and keep it from corroding. Some jackets protect from moisture, others from UV sunlight, others from chemical salts, and a very few from all three. In fact, the jacket alone can change the prices of identical transmission lines inside by a factor of three.
First, any length of wire has a inductance. For two wires parallel or concentric to each other, the total inductance for any arbitrary length is the sum of inductances of the two lines in series.
Second, any two lengths of wire parallel to each other show a capacitance, like plates. The capacitance of a fixed arbitrary length of parallel wires is a function of the wire sizes, the space between them, and the nature of the insulation or dielectric between them.
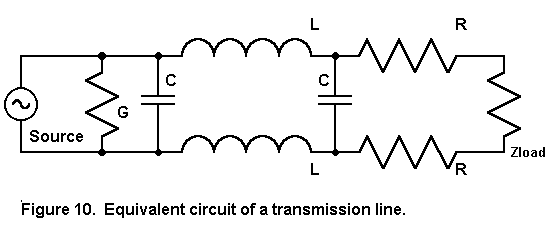
Figure 10 shows the two phenomena and prepares us for some old fashioned formulas.
First, for any transmission line, it is primarily the L and C per unit length that determine the characteristic impedance, Zo:

However, this equation is only approximate. for the record, let's look at the "big" formula:

where R is the series resistance per unit length and G is the shunt conductance per unit length--the unit lengths used for L and C. For most calculations, ignoring R and G does little harm, but for maximum precision, they are needed. They actually tell us that the Zo of virtually any line is not 100% resistive, but has a slight phase angle that shows up as those little remnant reactances in the Zo column of Table 1.
Because L and C are functions of the physical sizes of the conductive materials from which we make our transmission lines, we do not need to know the actual values of L and C per unit length to make a transmission line. We can use sizes and distances apart instead.
For parallel transmission lines, we calculate with the formula

where S is the center-to-center spacing of the conductors and d is the diameter of the conductors, both in the same units. The term "e" is the dielectric constant of the material between the lines, where a vacuum has a value of 1 and most solid material have higher values.
Too often, the version of this equation that we see in books leaves out the dielectric constant, and that leaves some gaps in our understanding. For example, with only air as a wire spacer, we cannot make a 50 or 75 ohm parallel transmission line, since it would require that the wires overlap. However, if we divide 276 by a higher number, resulting from the use of a dielectric with a high constant, then we can build our 75-ohm parallel line. However, even though we can, no one in the US does.
For a coaxial transmission line, we use this formula:

where D is the inner diameter of the outer conductor and d is the outer diameter of the inner conductor, both in the same units.
Both these formulas are handy. However, it is more likely that you would build a parallel transmission line (with an air dielectric with a constant of 1) than it is that you will build a coaxial cable.
Conclusion: whatever the type of feeder, use the largest wire diameter your system can physically withstand.
There is a second reason for power loss: Every dielectric leaks. Energy get across the space between the wires, trying to bake the insulation instead of proceeding to the end of the line. However, dielectric losses begin to dominate only above UHF frequencies.
How do we know lines leak and resist? Because we can measure the increase in temperature, even with a perfect match.
But why does SWR increase losses? We have not even said what SWR is, but we do know that when the SWR is 1:1, the voltage and current are everywhere the same along the line, except for the basic resistance and leakage losses. However, when the SWR is greater than 1:1, voltage and current change along the line, reaching peaks and nulls, as shown in Figure 11.
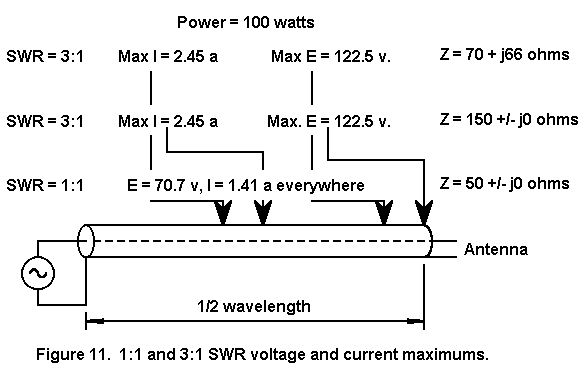
Even with a mild SWR of 3:1, the current reaches peaks 3 times the 1:1 value. Because wire has a certain resistance per unit length, the higher current results in higher resistive losses for a given voltage.
First, remember that the characteristic impedance of a transmission line is not its resistance. It is a resistive impedance, meaning that it is a product of two reactance so situated that they result in a zero phase angle (or darn close). The only energy dissipation is through the loss mechanisms described.
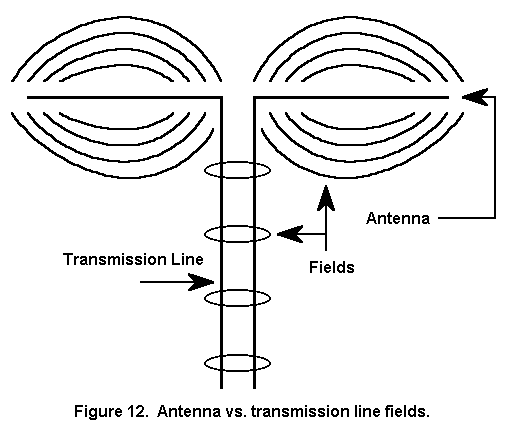
Second, resistive impedances control energy but do not dissipate it. Figure 12 shows how. Think of each wire as trying to be like the antenna at the end of the line. The antenna is a transducer that permits the development of a field that can spread without limit. All of the energy in the current distribution along the antenna wire is lost, since the field is in a form that allows no retention or recapture.
It is not incidental that every conductor in every circuit is trying to establish and maintain a field that spreads without limit. Hence, we have to shield, shorten leads, bypass, and take other measures to keep our circuits from radiating--or from radiating prematurely.
The wires in the transmission line are trying to do the same thing. However, the two conductors, with equal and opposite polarity voltages and currents confine the field to very narrow spaces, mostly between the conductors. The energy stands on the line and is propagated down the line. The transmission line is a field (or wave) guide that is highly efficient.
If you terminate the line with an antenna--any device that permits the field to expand without limit, all but the little dissipated energy in the lines reaches the antenna. If you short circuit or open circuit the line instead, it all returns to the source.
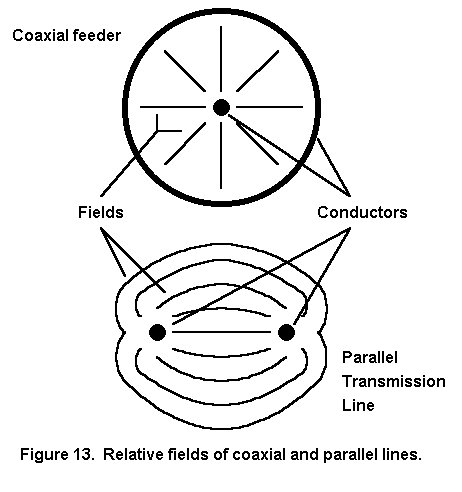
Figure 13 shows us once more the cross section of a coax cable and a parallel transmission line so that we can compare the fields. Because the outer conductor of the coax cable encloses the field between conductors, we get the so-called "shielding effect." All this means is that very near metallic objects have little or no effect on the fields between the transmission line conductors.
The parallel transmission line is not so fortunate. Although the fields are narrowly confined, they are not perfectly confined. Hence, bringing a conductive object near one line can disrupt the balance in currents and voltages that are crucial to proper operation of the line. Energy coupled to this external object is energy not in the nearer line, which leaves an excess in the other line. This is a good way to convert both the nearby object and the feedline into an unintended antenna.
Hence, keep parallel transmission lines away from conducting objects. Do not nail them through their insulation to posts. Instead, invent nonconductive clamps. Do not clamp them down to the window sill with aluminum window frames. You might get away with it, but you might also turn your window frame into an inefficient antenna and rob the efficient antenna in the trees of valuable power. Space the parallel transmission line several times its widest dimension from nearby conductive or unknown objects. How many is "several?" The more, the better.
I give up. Let's see what SWR really is. SWR is one way to register the mismatch between the ultimate load and the transmission line characteristic impedance. If the load impedance and the characteristic impedance of the transmission line are the same, then the SWR (or VSWR, more correctly) is 1:1.
SWR is not a measure of how well the antenna works. Low or high SWR numbers can occur for antennas with identical far field patterns operating with essentially the same efficiency.
SWR is a measure of what conditions exist on the transmission line. Those conditions exist all along the transmission line (with a little allowances for the losses we have seen). Hence, those condition appear in one or another form at the end of the transmission line you wish to connect to the transmitter. When the SWR is 1:1, those conditions presented to the transmitter are easily predicted. When the SWR is not 1:1, all bets are off.
Except: remember that we had you measure your transmission line. That will come in handy in just a bit.
Here I want to clear up just one common misconception and then move on to stuff more important than SWR. SWR is not simply the ratio of the antenna impedance to the Zo of the transmission line. Sometimes that ratio is not even close to the SWR.
Consider the following antenna impedances, all of which are presented to a 50-ohm coaxial cable: 1. 100 ohms resistive; 2. 70.7 ohms resistive and 70.7 ohms reactive (inductive for convenience; and 3. 100 ohms reactive. All cases result in an impedance magnitude of 100 ohms, one at zero degrees phase angle, the second at 45 degree phase angle, and the last at 90 degrees phase angle.
Although we are not yet sure why, we know the 100 ohms resistive case results in an SWR of 2:1. However, some may be surprised to learn that the second case shows an SWR of 3.27, while the third shows an SWR of -209.6 (yes, really a negative number). Why? The correct equations for SWR and impedance tell why.
To calculate SWR, let's define two arbitrary terms, A and B. In doing so, we shall let RL be the load or antenna resistance, XL be the load or antenna reactance, and Zo be the characteristic impedance of the line, ignoring that little reactance remnant in Table 1.

and

The only difference (although it is a big difference) is the + vs. - at the resistive ends of the expressions.

Actually, equation 9 is less interesting than equations 7 and 8. They tell us that the resistive and reactive parts of the load impedance are separately handled within the equations, so that the reactive portion is not part of the standard way in which we calculate impedances.
We can calculate the voltage, current, and impedance along any length of transmission line, obtaining both the magnitude and phase angle. In fact, any two of the three will do, since the impedance is simply the voltage divided by the current (with due attention to the phase angle).
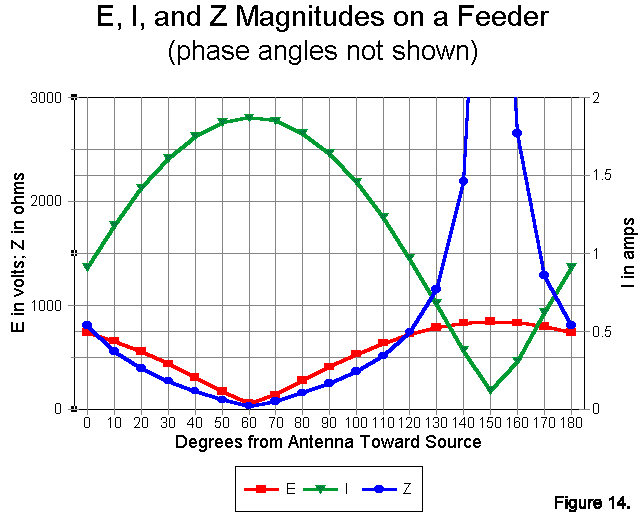
Figure 14 provides a view of the excursions of voltage, current, and impedance magnitudes (without reference to phase angles) along a 450-ohm transmission line from an extended double Zepp antenna. Its purpose is only to demonstrate that these values do not vary in many instances in nice, clean sine waves--nor even symmetrically within a half-wavelength span of line. For simple matching purposes, pure impedance curves tend to be most helpful. If we know the impedance and its phase angle, we can easily convert that to series values of resistance and reactance.
I shall bypass the temptation to toss out three more equations at you. Besides the fact that they are messy, all of the work has been done for lossless lines in one of the programs in the HAMCALC collection. There, you can specify any feeder Zo and VF, along with antenna-end values of R and X and some desired power level, and then see the value of voltage, current, and impedance (in both Z and R+/-jX forms) at any distance from the antenna or in a chart taken every 5 degrees along a line. If you can do without the chart and want losses thrown in, then use TLA by Dean Straw.
The big chart is handy for checking out what happens along a transmission line and for graphing the results. We are all taught that the impedance values repeat themselves every 180 degrees or half wavelength of transmission line. Unfortunately, most sources fail to teach us that voltage and current repeat their values only once every 360 degrees or full wavelength of feedline. That sort of neglect kept us in the dark about a number of interesting questions for nearly a half century, for example, how the element phasing of the ZL special really works.
Let's look at a few graphs made up from the tables to see what happens to the resistance and reactance in some typical scenarios. But first, let's go back to Figure 2, where we entered the electrical length of our hypothetical RG-213: 296.9 degrees. Since this is close to 300 degrees and my graphs use values for each 10 degrees, we shall use that nice round number. However, the graphs cut off at 180 degrees. Since all impedance phenomena repeat every 180 degrees, we simply subtract 180 from 300 to get 120 degrees. The values that appear at the 120-degree mark are the one's most likely to show up at the end of our coax.
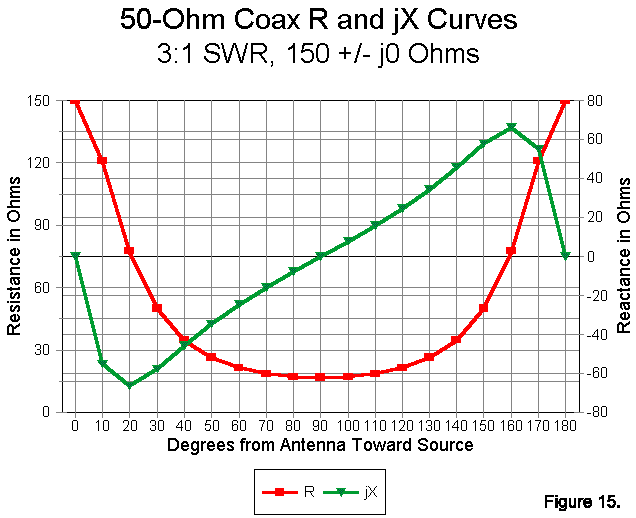
We can begin with Figure 15, a graph of resistance and reactance for an antenna impedance of 150 +/- j0 ohms. This is a resonant antenna with an SWR of 3:1 relative to our RG-213, with its characteristic impedance of 50 ohms. Because the antenna is resonant, note the nice symmetry of the curves--and be sure to read each from the correct Y axis: left for resistance and right for reactance.
First, it is not the case that everywhere along the lines, the R +/- jX values yield an impedance of 150 ohms. Instead, everywhere along the (lossless) line, the SWR is 3:1. Second, note that the reactance can reach well above 60 ohms (capacitive or inductive, depending on the length of the line). Third, at the 120-degree mark, we read an impedance of about 21 + j25 ohms.
This last figure tells us something important. The reactance figure is one that most network tuners can handle with ease, while the 2.5:1 ratio of source resistance (50 ohms) and presented resistance is fairly easily handled by almost any common tuner. So, if we can stand the cable loss of a 3:1 SWR, along with the slight tuner losses, we can easily match our antenna-feedline to the transmitter.
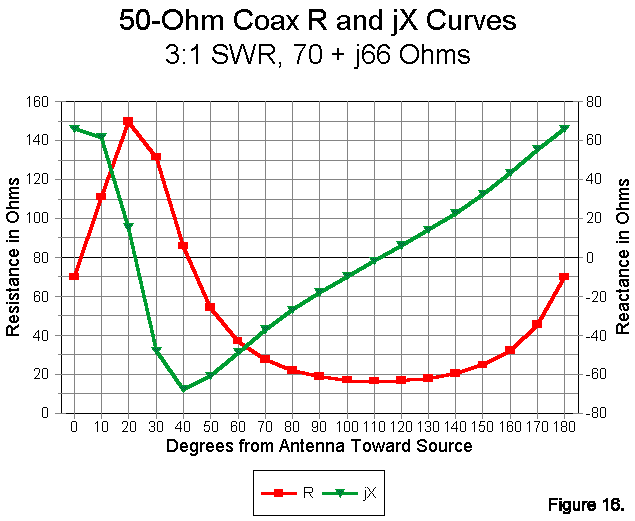
Now consider Figure 16. Here we also have a 3:1 SWR with our RG-213. Note that this SWR occurs with an antenna impedance of 70 + j66 ohms. At the 120-degree mark, we find an impedance of about 17 + j6 ohms. Although the reactance is low, so too is the resistance. Most network tuners will handle the job, but at slightly less efficiency than the previous case. Same SWR, but different tuning conditions and different impedance value.
Actually, Figure 15 and Figure 16 present the same curves, shifted by the reactance on the line. For a given line Zo, every curve with the same SWR will overlap every other curve of the same SWR, with only an adjustment down the line according to the relationship of R to jX at the antenna. Note the peak resistance of 150 ohms near the 20-degree mark, at which point the reactance is close to zero (the slight variance being a result of using 10-degree increments for our marks). Note that inductive reactance pushes peak resistance down the line away from the antenna.
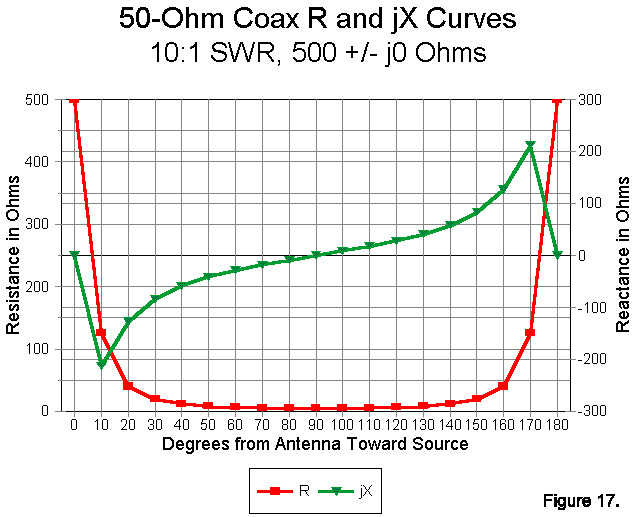
In Figure 17, we see the resistance and reactance curves for a resonant 500-ohm antenna with a 50-ohm coax feeder--a 10:1 SWR situation. As with all resonant antennas, the curves are symmetrical through the 180- degree line span. It is most important to note for how much of the span (120 degrees or two-thirds) that the resistance is below 20 ohms. Our tendency is often to think of high SWR being associated with high values of impedance, when precisely the opposite is generally true: for most of the line length, the resistive component of the impedance is very low.
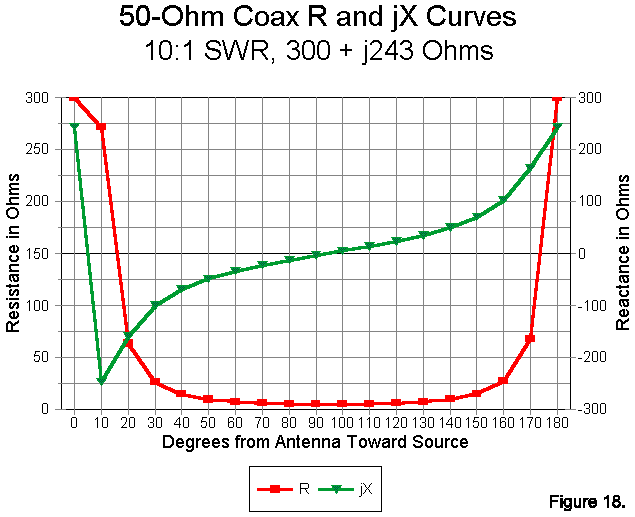
The same 10:1 SWR applies to Figure 18, with an antenna feedpoint impedance of 300 + j243 ohms. It may not be readily apparent that this curve overlays Figure 17 exactly. The peak resistance value of 500 ohms occurs at the 5-degree mark. Hence, the automated resistance Y-axis does not replicate. However, the reactance Y-axis scale shows the overlap of those curves.
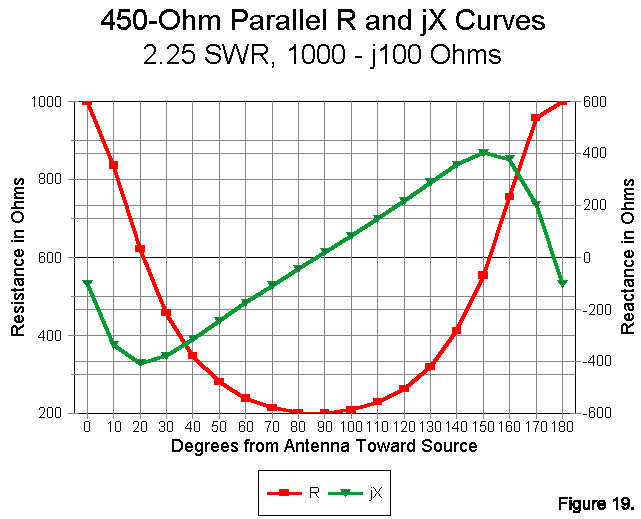
Suppose that our 74' 10.5" of feedline had been 450-ohm "window" line with a VF of 0.95. Our line would be 206 degrees long, and we would look at the 26-degree mark on any relevant charts. The closest 10-degree point is, of course, 30 degrees. Using that number, lets see what happens if we use this parallel feeder with an antenna whose feedpoint impedance is 1000 - j100 ohms. Figure 19 tells the story. Because the impedance is slightly capacitive, the graph is shifted toward the antenna end, with the first graphable resistance peak between the 175 and 180 degree marks. Although the reactance at the antenna is only -100 ohms, the reactance value along the length of line varies from +400 to -400 ohms. At the end of the line we ran (the 30-degree mark), the impedance presented to the ATU is about 450 - j375 ohms--a fairly easy matching situation for any truly balanced ATU.
There are numerous matching schemes that do away with the ATU proper. Instead, they try to use calculated or experimentally determined line lengths to intercept something close to a 50-ohm resistive point on the line and then add enough reactance across the line to yield a net reactance of zero. Unfortunately, here is an antenna and feedline combination on which that technique would fail. Notice that the resistive component of the antenna never falls below 200 ohms. However, since this value occurs just about where the reactance crosses the zero line, a 4:1 balun might work with a line length just under 90 degrees (or 270 degrees, etc.). Direct reactance cancellation at or near the point along a 450-ohm line of a current maximum works best if the SWR is middling (4:1 to 6:1) or the reactance holds a 2:1 (or lower) ratio to the resistance for higher resistance values. Otherwise, the resistance along the line may not approach 50 ohms or may occur in a region of very rapidly changing values, making tuning excessively sharp.
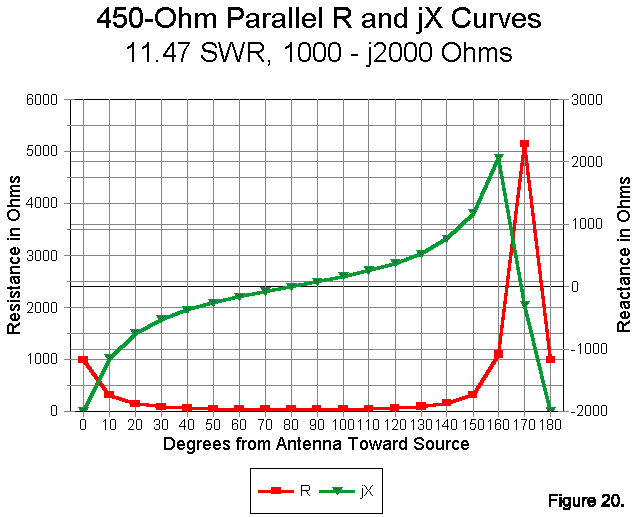
More common with antennas near (but not at) a multiple of a wavelength long is the situation exemplified by Figure 20. The antenna impedance of 1000 - j2000 ohms yields an SWR of 11.47. Notice the very brief spike in the resistance curve, with the remainder of the curve at a low resistance. This curve graphically demonstrates the danger of using a 4:1 balun between the feedline and a network tuner. Let's examine our 30-degree mark. Ignoring the 200-ohm reactance, which tends to disrupt normal transmission- line transformer operation, the 90-ohm resistive component would simply be reduced to 22.5 ohms, a worse situation than would be the case with a 1:1 ferrite bead choke in place of the toroidal balun. At some points along the line, the resistive component will fall to under 10 ohms with the 4:1 system. Antenna situations like this one--which is quite common--make a good case for hauling out the old link-coupled antenna tuner.
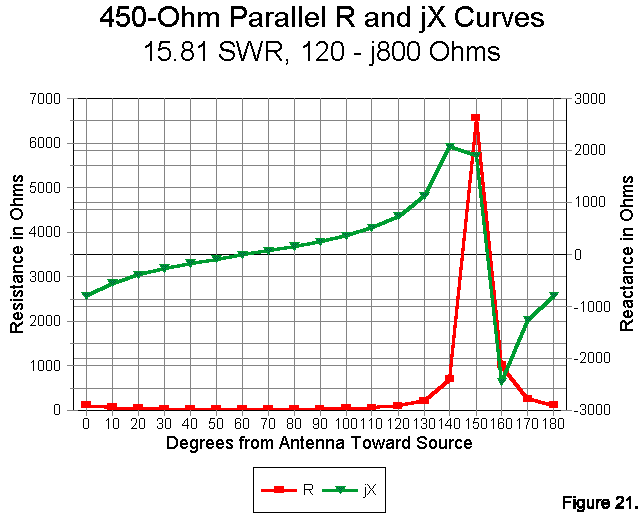
We can close our series of examples with Figure 21, a 450-ohm line feeding an Extended Double Zepp (EDZ). Typically, these antennas show a feedpoint impedance of about 120 - j800 ohms (plus or minus about 20 percent, depending on the exact length of the antenna). Notice the very high spike in resistance and the very long series of very low resistance values. Also notice that there are two regions to the graph: a. a region from about 20 to 120 degrees where values change slowly and b. a region from 120 to 180 degrees where they change almost wildly. If you want freedom from ATU matches that change with weather conditions such as rain, ice, or even wind, choose a line length that ends up in the "slow-change" area.
The series of graphs can be extended indefinitely. However, if you study the examples given, you will begin to develop a fairly good intuitive feeling for what happens to impedance along a continuous impedance transformer called a transmission line. Add a program to calculate actual values for you, and you can convert your intuitions into intelligent decisions in the selection of feeder lines and line lengths for your installation.
Arithmetically, the relationships look like this:

where Zo is the characteristic impedance of the quarter-wavelength matching section of line needed or chosen to do the matching job, Z1 is the impedance at one end of the section, and Z2 is the impedance at the other end of the line.
This property of transmission lines is most useful with essentially resistive loads (very low reactances). With coaxial cable, it solves the problem of matching some common antennas to our ubiquitous 50-ohm feedline.
Some common quad beam design have feedpoint impedances of 100-ohms. One can purchase an expensive 2:1 balun, but that is unnecessary. Since the two impedances, 100 ohms and 50 ohms have a product of 500, the square root is 70.7 ohms. A quarter wavelength section of any common 70-ohm cable, cut with respect for its VF, will effect the transformation.
Many good Yagi designs have feedpoint impedances of about 25 ohms. To use a 50-ohm coax cable as our feedline, we need a quarter wavelength section of the square root of 1250, or 35.4 ohms. We can make such a line with parallel sections of 70-ohm feedline.
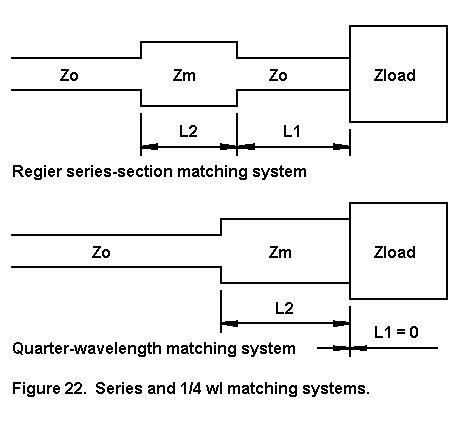
In fact, the quarter wavelength magic matching section is a special case of the more general series-section matching technique worked out by Frank Regier, OD5CG, about 1970. It appeared in QST in 1978 and has had a place in the ARRL Antenna Book ever since. As shown in Figure 22, the quarter-wave section match is simply a series match where the length of L1 is zero. Interestingly, the match-line and stub system is also a special case of the series match system, where the series section is replaced by a parallel capacitive or inductive stub.
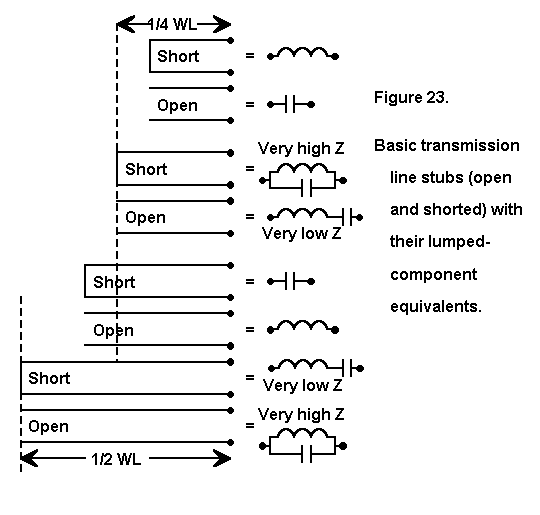
Figure 23 shows the basic relationships between transmission line length and its function as a circuit component. If the line is exactly 1/4 or 1/2 wavelength long, then it is resonant and has no reactance. However, at all other lengths, the line is either a capacitive reactance or an inductive reactance, depending upon whether it is open-circuited of closed- circuited (shorted). Notice that the lines change reactance types as they pass the 1/4-wavelength point.
The actual reactance is easy to calculate. For a closed-circuit line,

where XC is the reactance of a closed-circuit length of transmission line, Zo is the characteristic impedance of the line, and L is the length in electrical degrees. Note that we shall have to use the conversion process we learned in section 2 to convert electrical length to and from physical length.
For an open-circuit line, we use

where XO is the reactance of the open-circuit length of transmission line. Again, we use the standard conversion process to go between physical and electrical line lengths.
In both cases, the sign of the X-term will specify the type of reactance: positive for inductive and negative for capacitive.
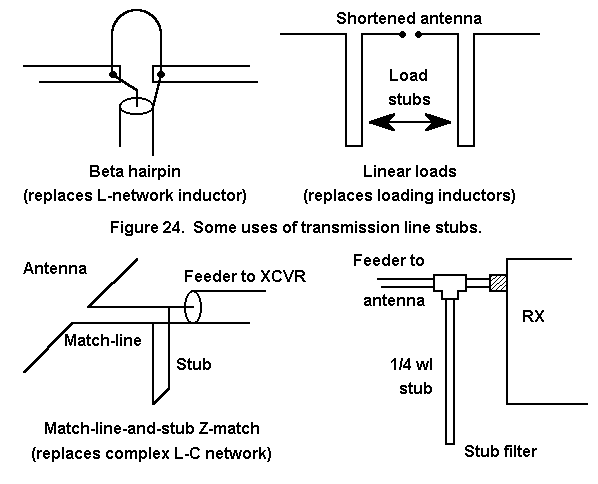
We use actual capacitors and inductors to produce desired reactances in circuits. In principle, we can substitute transmission lengths in every case, although the practice is bulky except in the microwave region. At HF, some of the most common uses for transmission line stubs are illustrated in Figure 24. The beta-match hairpin is simply a transmission- line version of the beta-match coil. Linear loaded antenna elements are transmission-line substitutes for loading coils. One-quarter wavelength stubs can replace lumped components in the formation of frequency-specific, high-Q filters.
The match-line-and stub system of matching an antenna to a feed line is especially interesting. Although there are some conditions that will not permit a match, wherever one is possible, four are possible. HAMCALC has a program that will calculate matches for possible cases. Let's use such a match on our EDZ example with a feedpoint impedance of 100 -j800 ohms. Suppose we wish to connect this to a 50-ohm coaxial cable at 7.15 MHz. Let's specify 450-ohm, VF-0.95 window line for both the match line and the stub.
If we use a match line length of 21.02' (6.41 m), then we can attach a 2.65' (0.81 m) shorted stub or a 35.32' (10.77 m) open stub to effect our match to 50-ohm coax. With a length of 23.312' (7.11m), we can use a 62.69' (19.11 m) shorted stub or a 30.02' (9.15 m) open stub. All will work, but--of course--we normally choose the shortest combination of matchline and stub that will achieve the goal. For monoband antennas with odd feedpoint impedances, the match-line and stub system is a handy tool indeed. Incidentally, the stub reactances are all (+/-) 57.7 ohms, and we could apply a capacitor or inductor across the line in place of the open or shorted stub, respectively.
However, these 12 ways of looking at feeders will hopefully provide you with the means to sort out all the kinds of things you already know about feedlines so that you can feel more comfortable with them. The 12 ways are just a means of making sense out of a lot of information. I have said nothing new on the subject. Except, perhaps, that my feeders like to know that I love them.
For reference, here are a few equations of use. In the following, Er is the voltage at the antenna, Ir is the current at the antenna, Zr is the impedance at the antenna, Zo is the characteristics impedance of the transmission line, and L is the length in electrical degrees.
1. To determine the voltage (Es) anywhere along a transmission line from the antenna:

2. To determine the current (Is) anywhere along a transmission line from the antenna:

3. To determine the impedance (Zs) anywhere along a transmission line from the antenna:
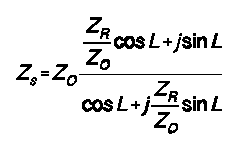
Each of these equations has a real and an imaginary (j) part, which can be solved separately and recombined to yield a magnitude and a phase angle. Morover, the voltage, current, and impedance at the antenna may also be a magnitude at a phase angle, thus requiring further subdivision of the equations. The techniques described by Keucken in Exploring Antennas and Transmission Lines by Personal Computer can be useful in setting these equations up in one or more of the common programming languages.
These equations are for lossless lines. Similar equations exist for lossy lines and involve the use of the value of Zo derived from the series impedance per unit length and the shunt admittance per unit length, along with sinh and cosh functions. For lossy lines, the impedance at some distance from the source is given by
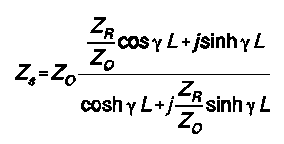
where "gamma" is a complex loss coefficient comprised of the matched-line loss attenuation constant and the line phase constant and L is given in units matching those of gamma. These equations lend themselves to computer solution to speed computation and ensure precision, although the elegance of the Smith Chart lies in its ability to handle them graphically.
The relationships among the line characteristic impedance, Zo, and the voltage and current along the line (treated variously as forward and reflected voltage or current, or as maximum and minimum voltage or current) are too numerous to cover here. However, using Zo as the characteristic impedance of a lossless line, we can define the reflection coefficient, rho, as follows:
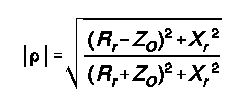
where Rr and Xr are the resistive and reactive components of the impedance Zr as used in the preceding equations. SWR (voltage or current standing wave ratio) is simply

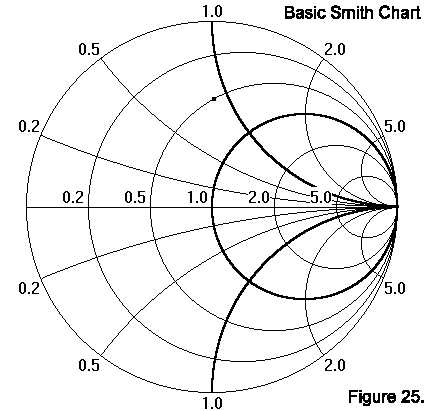
which may make apparent the direct calculation of SWR given in the main text. The fact that the reflection coefficient, and hence SWR, are circular functions is the key to understanding the construction of the Smith Chart, a simplified version of which is shown in Figure 25.
As you delve into the variety of literature, you will encounter variations of both notation and form of the equations shown here for reference and others related to them. It is useful to keep a log of the variations in the texts to which you refer most often to ensure ease in following a set of calculations or discussion of the phenomena described by these equations.
The following software may be useful in calculating various problems with transmission lines:
HAMCALC, version 32, by George Murphy, VE3ERP, 77 McKenzie Street, Orillia, ONT L3V 6A6, Canada. Murph requests that users send him $5.00 to cover the cost of the disk, a mailer, and postage from Canada. Any excess over costs is donated to the Canadian National Institute for the Blind amateur radio program.
TLA, by Dean Straw, N6BV, comes with the current edition of the ARRL Antenna Book or can be obtained from the ARRL BBS.
MicroSmith, by Wes Hayward, W7ZOI, available from ARRL.
The following books and chapters may be useful to you in furthering your understanding of transmission lines.
R. Dean Straw, N6BV, ed., The ARRL Antenna Book (Newington: ARRL, 1997), Chapter 24.
Joseph J. Carr, Practical Antenna Handbook, 2nd Ed. (New York: TAB Books, 1994), Chapter 3.
Wilfred N. Caron, Antenna Impedance Matching (Newington, ARRL, 1989): one of the finest tutorials on Smith Chart use.
M. Walter Maxwell, Reflections: Transmission Lines and Antennas (Newington, ARRL, 1990): perhaps the best source book for overcoming misconceptions about transmission lines and SWR.
Jerry Sevick, Transmission Line Transformers, 2nd Ed. (Newington: ARRL, 1990): this and other of Sevick's books are authoritative on the subject.
For advanced reading, I recommend the following:
Richard C. Johnson, ed, Antenna Engineering Handbook, 3rd Ed. (New York: McGraw-Hill, 1993), Chapter 42.
John A. Keucken, Antennas and Transmission Lines (Starkeville, MS: MFJ, 1996), Chapters 16-25 (a reprint of a fine text). See also Keucken's Exploring Antennas and Transmission Lines by Personal Computer.
Frederick E. Terman, Radio Engineers' Handbook (New York: McGraw-Hill,
1943), Section 3.
Ronold W. P. King, Transmission Line Theory (New York: Dover, 1965); a
highly theoretical work for the exceptionally curious.
Updated 5-19-98. © L. B. Cebik, W4RNL. Data may be used for personal purposes, but may not be reproduced for publication in print or any other medium without permission of the author.