
 Modeling the Dual Rhomboid
Of course, some scaling would be necessary. The CATJ versions were cut for the television channels, with a 100 MHz model for reference (or for FM reception use). So we can expect in this part to find antennas over 12 times larger than the 1296 MHz model. Replacing inches with feet for the Part-1 model will give an idea of the size difference.
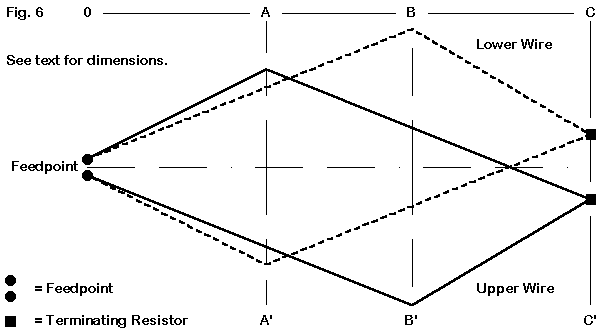
Fig. 6 repeats the sketch in Part 1, but without dimensions. Just why will become immediately apparent.
Sometimes a casual reading must give way to a close reading, and in the process, what seemed clear becomes a bit muddy. The CATJ article provides dimensions in two ways: approximations of the distances from the feedpoint to the supporting cross members and angles between the two short legs and between the two long legs. (There is a further ambiguity because the picture of the angles refers to angles A and B but references a table where the only angles given are called X and Y.) The result was two sets of dimensions. One was based on using the prescribed leg lengths plus sines and cosines of the angles given, which resulted in what I call the narrow model. The second version was based on the approximated cross member dimensions, which yielded what I call the wide model. We shall look at a third model before we are done.
The dimensions for the narrow and wide models are as follows, using #12 AWG copper wire and the prescribed 600-Ohm loads. Refer to Fig. 6 to place each dimension.
Narrow Model
0-A  31'            A-A'   30.30'
0-B  56'            B-B'   38.12'
0-C  88.5'          C-C'   7.8'

Wide Model
0-A  31'            A-A'   31.50'
0-B  56'            B-B'   39.35'
0-C  88.5'          C-C'   7.8'
For model construction in each case, I used the method of creating right angles among wires at the feedpoint area as perhaps yielding a more trustworthy model than bringing the wires together at a very shallow angle. The following model description table illustrates the modeling technique.
Dual Rhomboid:  Laport-CATJ                  Frequency = 100  MHz.

Wire Loss: Copper -- Resistivity = 1.74E-08 ohm-m, Rel. Perm. = 1

              --------------- WIRES ---------------

Wire Conn.--- End 1 (x,y,z : ft)  Conn.--- End 2 (x,y,z : ft)  Dia(in) Segs

1   W8E2  -0.100,  0.000,  0.000  W2E1  -0.100,  0.000,  0.100    # 12    1
2   W1E2  -0.100,  0.000,  0.100  W3E1 -15.750, 31.000,  0.100    # 12   75
3   W2E2 -15.750, 31.000,  0.100  W4E1   3.800, 88.500,  0.100    # 12  125
4   W3E2   3.800, 88.500,  0.100  W5E1   4.000, 88.500,  0.100    # 12    3
5   W4E2   4.000, 88.500,  0.100  W6E1  19.670, 56.000,  0.100    # 12   75
6   W5E2  19.670, 56.000,  0.100  W7E1   0.100,  0.000,  0.100    # 12  125
7   W6E2   0.100,  0.000,  0.100  W8E1   0.100,  0.000,  0.000    # 12    1
8  W15E2   0.100,  0.000,  0.000  W9E1  -0.100,  0.000,  0.000    # 12    3
9   W1E1  -0.100,  0.000,  0.000 W10E1  -0.100,  0.000, -0.100    # 12    1
10  W9E2  -0.100,  0.000, -0.100 W11E1 -19.670, 56.000, -0.100    # 12  125
11 W10E2 -19.670, 56.000, -0.100 W12E1  -4.000, 88.500, -0.100    # 12   75
12 W11E2  -4.000, 88.500, -0.100 W13E1  -3.800, 88.500, -0.100    # 12    3
13 W12E2  -3.800, 88.500, -0.100 W14E1  15.750, 31.000, -0.100    # 12  125
14 W13E2  15.750, 31.000, -0.100 W15E1   0.100,  0.000, -0.100    # 12   75
15 W14E2   0.100,  0.000, -0.100  W7E2   0.100,  0.000,  0.000    # 12    1

              -------------- SOURCES --------------

Source    Wire      Wire #/Pct From End 1    Ampl.(V, A)  Phase(Deg.)  Type
          Seg.     Actual      (Specified)
1           2     8 / 50.00   (  8 / 50.00)      1.000       0.000       I

              --------------- LOADS ---------------

Load      Wire      Wire #/Pct From End 1      R (Ohms)       X(Ohms)
          Seg.     Actual      (Specified)
1           2     4 / 50.00   (  4 / 50.00)     600.000         0.000
2           2    12 / 50.00   ( 12 / 50.00)     600.000         0.000

Ground type is Free Space
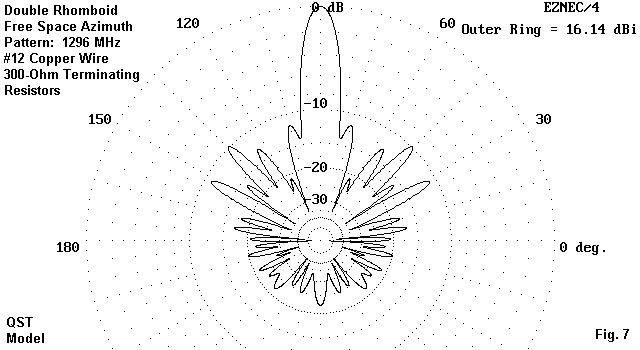
Before looking at the results of modeling these 100 MHz models, let's review Fig. 7. This is a free space azimuth pattern for one of the best 1296 MHz models, using #12 wire and 300-Ohm terminating resistors to achieve maximum front-to-back ratio. Remember that #12 wire is about 12 times fatter at 1296 MHz relative to a wavelength than it will be at our new test frequency of 100 MHz.
At 100 MHz, with 600-Ohm terminating resistors, the basic numbers given by NEC-4 for the performance of the narrow and wide models are as follows:
Model     Gain      F-B       B/W       F/S       Feed Z
          dBi       dB        deg       dB        R+/-jX
Narrow    14.96     21.94     12.2      11.56     388 - 144
Wide      15.26     24.11     11.8      11.36     364 - 148
The respective free-space azimuth patterns are shown in Fig. 8 and Fig. 9.
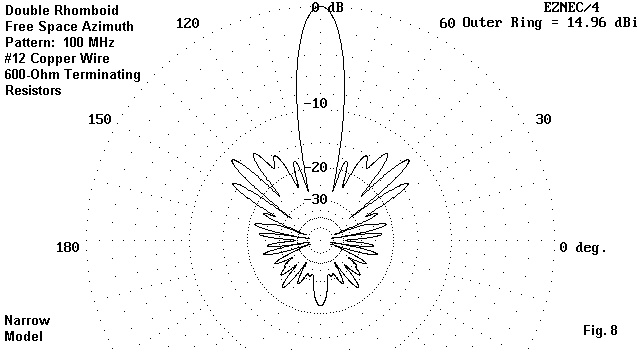
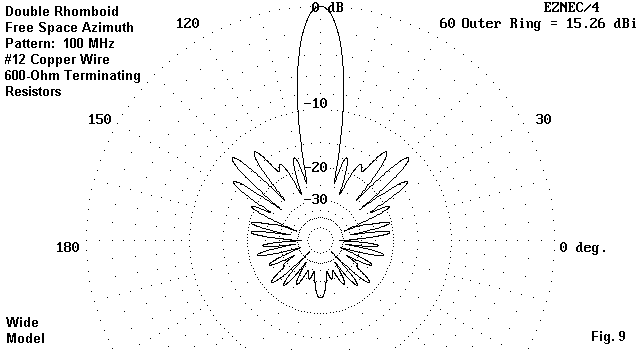
Both models show less gain than the 1296 MHz model, but considerably better front-to-back ratio with the prescribed 600-Ohm terminating resistors. The beamwidth at 100 MHz is wider by a small amount, and the front-to-side lobe ratio is better, also by a small amount. Perhaps the major fact that becomes evident, especially in the narrow model, is the reduction in the amount of power overall in the rearward lobes. Every lobe past 60 degrees from the main lobe is down by at least 20 dB and mostly more. One goal of the Laport dual rhomboid design is at least partially met in these models.
To see what effect wire size might have on performance, I ran the wide model using wire sizes from #12 through 0.5" in diameter. Throughout the exercise, the dimensions remained constant and the terminating resistors were a constant 600 Ohms.
Wire      Dia.      Gain      F-B       B/W       F/S       Feed Z
Size      In.       dBi       dB        deg       dB        R+/-jX
12        0.0808    15.26     24.11     11.8      11.36     364 - 148
10        0.1019    15.29     25.39     11.8      11.29     345 - 147
 8        0.1285    15.31     26.81     11.8      11.21     327 - 145
 6        0.1620    15.33     28.27     11.8      11.13     309 - 144
 4        0.2043    15.34     29.69     11.6      11.04     292 - 143
 2        0.2576    15.35     31.07     11.6      10.95     275 - 141
--        0.3       15.36     31.94     11.6      10.89     264 - 140
--        0.4       15.40     33.49     11.6      10.76     242 - 136
--        0.5       15.49     33.62     11.6      10.66     222 - 131
Obviously, the performance of the dual rhomboid benefits from the use of fatter wire, whether used as a single wire or as a simulated fat wire composed of separated parallel wires. The chart does not peak within the range of values checked (nor does a similar chart for the narrow model). As we saw with the 1296 MHz model, the front-to-side lobe ratio and the feedpoint impedance both decrease with increases in the front-to-back ratio and gain.
It may be the case that using a single wire size of #6 AWG may be the most practical compromise for a 100 MHz dual rhomboid. Wire of this size or larger might best be aluminum for weight saving. Therefore, I compared the performance figures for both #12 and 0.5" wire in copper and aluminum.
Wire      Wire      Gain      F-B       B/W       F/S       Feed Z
Size      Type      dBi       dB        deg       dB        R+/-jX
12        copper    15.26     24.11     11.8      11.36     364 - 148
12        alum.     15.24     24.10     11.8      11.39     364 - 148

0.5"      copper    15.49     33.62     11.6      10.66     222 - 131
0.5"      alum.     15.49     33.59     11.6      10.68     222 - 131
Since the performance differences between copper and aluminum wire are non-existent at the limits of the chart, any wire size within the chart will give equivalent performance, whether copper or aluminum.
As I did with the 1296 MHz model, I checked the new models to determine whether different values of terminating resistors would yield better performance than the standard 600-Ohm values. As a quick reference, here are numbers for the wide models using #12 wire and using #6 wire (copper).
#12 Copper Wire

Res.      Gain      F-B       B/W       F/S       Feed Z
Size      dBi       dB        deg       dB        R+/-jX
600       15.26     24.11     11.8      11.36     364 - 148
650       15.26     27.13     11.8      11.34     356 - 146
700       15.27     30.13     11.8      11.33     350 - 145
750       15.27     31.06     11.8      11.30     344 - 143
800       15.27     29.15     11.8      11.28     338 - 142

#6 Copper Wire

Res.      Gain      F-B       B/W       F/S       Feed Z
Size      dBi       dB        deg       dB        R+/-jX
600       15.33     28.27     11.8      11.13     309 - 144
650       15.33     31.22     11.8      11.10     304 - 142
700       15.34     31.05     11.8      11.09     299 - 141
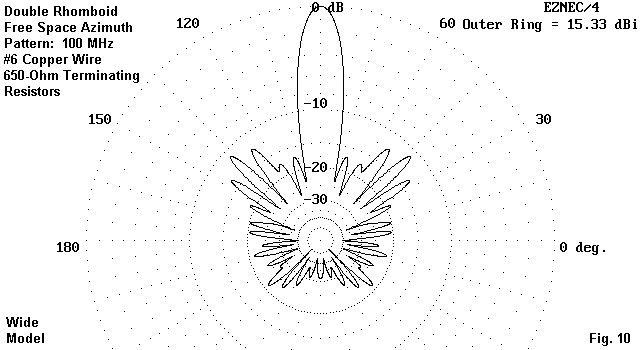
The gain of this model (and likewise, the narrow model) rises very slowly (insignificantly so) as the value of the terminating resistors increases. However, the front-to-back ratio shows a peak that results from the interrelationship of the wire size and the terminating resistor values. The 650-Ohm value for #6 wire is close to the value recommended by Laport's original design. For reference, Fig. 10 shows the azimuth pattern for the #6 wire wide model with the optimal terminating resistor values.
Scaled QST Model
0-A  29.7'          A-A'   32.94'
0-B  54.0'          B-B'   45.90'
0-C  83.16'         C-C'   11.0'
To translate the model to 100 MHz, certain modifications were necessary. Relative to pure scaling, the spacing between rhomboids had to be reduced (to 0.2') and the spacing between feedpoint area leg junctions also had to be reduced to manageable values (0.2'). For reference, here is the model description.
Dual Rhombic-QST 3-97, p89                 Frequency = 100  MHz.

Wire Loss: Copper -- Resistivity = 1.74E-08 ohm-m, Rel. Perm. = 1

              --------------- WIRES ---------------

Wire Conn.--- End 1 (x,y,z : ft)  Conn.--- End 2 (x,y,z : ft)  Dia(in) Segs

1   W8E2  -0.100,  0.000,  0.000  W2E1  -0.100,  0.000,  0.100    # 12    2
2   W1E2  -0.100,  0.000,  0.100  W3E1 -16.470, 29.700,  0.100    # 12   75
3   W2E2 -16.470, 29.700,  0.100  W4E1   5.940, 83.160,  0.100    # 12  120
4   W3E2   5.940, 83.160,  0.100  W5E1   7.020, 83.160,  0.100    # 12    3
5   W4E2   7.020, 83.160,  0.100  W6E1  22.950, 54.000,  0.100    # 12   75
6   W5E2  22.950, 54.000,  0.100  W7E1   0.100,  0.000,  0.100    # 12  120
7   W6E2   0.100,  0.000,  0.100  W8E1   0.100,  0.000,  0.000    # 12    2
8  W15E2   0.100,  0.000,  0.000  W9E1  -0.100,  0.000,  0.000    # 12    1
9   W1E1  -0.100,  0.000,  0.000 W10E1  -0.100,  0.000, -0.100    # 12    2
10  W9E2  -0.100,  0.000, -0.100 W11E1 -22.950, 54.000, -0.100    # 12  120
11 W10E2 -22.950, 54.000, -0.100 W12E1  -7.020, 83.160, -0.100    # 12   75
12 W11E2  -7.020, 83.160, -0.100 W13E1  -5.940, 83.160, -0.100    # 12    3
13 W12E2  -5.940, 83.160, -0.100 W14E1  16.470, 29.700, -0.100    # 12  120
14 W13E2  16.470, 29.700, -0.100 W15E1   0.100,  0.000, -0.100    # 12   75
15 W14E2   0.100,  0.000, -0.100  W7E2   0.100,  0.000,  0.000    # 12    2

              -------------- SOURCES --------------

Source    Wire      Wire #/Pct From End 1    Ampl.(V, A)  Phase(Deg.)  Type
          Seg.     Actual      (Specified)
1           1     8 / 50.00   (  8 / 50.00)      1.000       0.000       I

              --------------- LOADS ---------------

Load      Wire      Wire #/Pct From End 1      R (Ohms)       X(Ohms)
          Seg.     Actual      (Specified)
1           2     4 / 50.00   (  4 / 50.00)     600.000         0.000
2           2    12 / 50.00   ( 12 / 50.00)     600.000         0.000

Ground type is Free Space
Here is a small chart comparing #12 models with 600-Ohm terminating resistors for all three models:
Model     Gain      F-B       B/W       F/S       Feed Z
          dBi       dB        deg       dB        R+/-jX
Narrow    14.96     21.94     12.2      11.56     388 - 144
Wide      15.26     24.11     11.8      11.36     364 - 148
Scaled    15.52     32.65     10.4      10.12     293 -  96
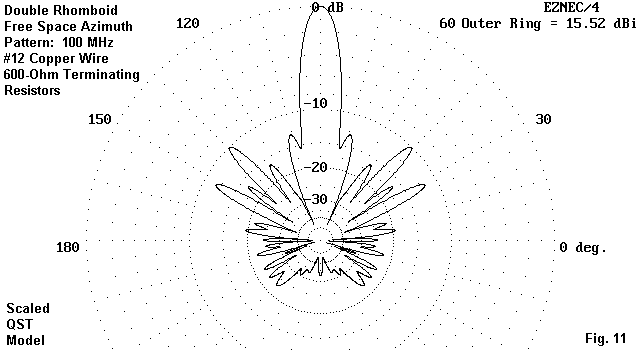
Fig. 11 presents the free-space azimuth pattern for the scaled QST model as adjusted. Note the slightly higher gain and front-to-back ratio, but the narrower beamwidth and lower front-to-side lobe ratio. Among the more subtle features to notice when comparing patterns is the first lobe off the main lobe. In the narrow and wide CATJ models, it is a low-level distinct lobe. In the scaled QST model, the first lobe is stronger and melds with the main lobe. Whether features like these make an operational difference in most ham circumstances is dubious. However, they are interesting theoretically when considering what Laport was trying to accomplish with his design.
If the side lobes are not especially troublesome, the scaled QST 1296 MHz model may be the more advantageous design, considering the gain, front-to-back ratio, and feedpoint impedance. However, if the power to the rearward lobes is of concern for a particular operation, the CATJ version may end up as more suitable.
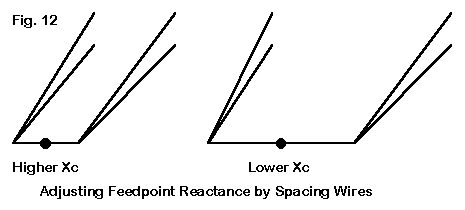
Where the wires of the legs join, the spacing between leg pairs can be widened or narrowed. Narrowing the spacing tends to push reactance further into the capacitive region. Widening the spacing pushed the reactance less capacitive and more toward inductive. Although the models may not predict the exact reactance value to be encountered with a dual rhomboid, the trends should be quite reliable in field adjusting the feedpoint reactance.
The dual rhomboid models produce consistent narrow beamwidth gains between 15 and 16 dBi in free space. At 100 MHz, the require length is 83-89 feet, with a 38 to 45 foot maximum width. What these numbers do not tell us is whether the antenna is worth building. So far we have produced no standards of comparison. For example, what would be the performance of a simpler single wire rhombic at 100 MHz? Does the dual rhombic have enough of a gain advantage to warrant the added construction difficulties? How large would a Yagi or equivalent gain be?
It may be useful to add one more part to this series to provide some basis for the individual to decide if the dual rhomboid is indeed the way to go.
Updated 8-16-99. © L. B. Cebik, W4RNL. Data may be used for personal purposes, but may not be reproduced for publication in print or any other medium without permission of the author.