
 3. Transmission Lines as Lines
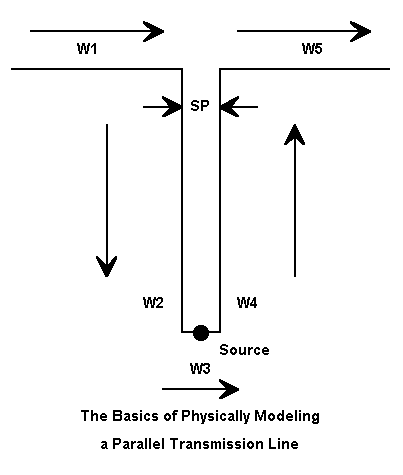
These simple facts determine the basic rules for modeling a parallel transmission line as a parallel set of wires. First, we break the single antenna wire element into two segments, with the centermost ends spaced the same distance apart as the spacing of the wires in the transmission line.
In the figure are a set of arrows indicating ends 1 and 2 of each wire, using a left-to-right convention for this example. Note that we keep the series of wires continuous so that End 2 of Wire 1 connects to End 1 of Wire 2, etc. This is crucial to ensure that the transmission line has equal and opposite currents at every point. (For many placements of transmission lines, the "equal and opposite currents" situation will not fully materialize in reality. However, we always model the transmission line in the manner shown.)
The source wire may simply be a one-segment wire from one side of the transmission line to the other. This wire will only be as long as the spacing between transmission line wires, and its segment length sets some specifications for the transmission line segmentation.
Segments that meet at angular junctions should be about the same length and in any event within about a 2:1 length ratio. Closely spaced transmission lines require much shorter segments due to the close spacing of their wires. The similar junction at the top of the assembly, where transmission lines wires and antenna wires meet, dictates short antenna wire segments lengths. Even for simple antennas, the entire assembly can quickly grow past the overall segment limit (usually abut 500) for modestly priced commercial NEC packages.
One possible solution is to taper the segments lengths along the transmission line, especially at the end closest to the source. EZNEC provides for element length tapering. However, the shortest segment length selected should not be the standard value (0.0025 wavelength), but should match the element spacing. However, NEC-2 recommends that no segment be shorter than 0.001 wavelength long, which the spacing of a 300-ohm line will violate at many HF frequencies. Errors for lines in the 450-ohm to 600-ohm range run about 5 ohms difference from full segmentation (at the test frequency of 14.15 MHz and save from 30 to 130 segments per 1/4 wavelength of each side of the transmission line.
Physical transmission lines are usually calculated according to one of two equations:

where Zo is the characteristic impedance of the resulting air-insulated parallel feedline, S is the center-to-center wire spacing, and d is the wire diameter in the same units as S. The first form is handiest for calculators, while the second form is somewhat more accurate for closely spaced lines.
Program suites such as HAMCALC have modules for calculating the Zo from the wire size and spacing of air-insulated lines--or for calculating any third factor from the other two. Note that these equations do not account for insulation other than air, and the velocity factor is either 1.0 or very close to it. Therefore, any models of physical transmission lines should be based on a velocity factor of 1.0 and the results later readjusted for the actual velocity factor of the line used. Likewise, any losses due to the dielectric must also be accounted for after modeling.
Interestingly, an extensive series of models using NEC-4 reveals that transmission lines between 300 and 600 ohms show a higher impedance than that calculated for them with the equations. The figure immediately below shows the test modeling arrangement. Instead of an antenna structure at the top of the transmission line, the lines were bridged with a resistive load.
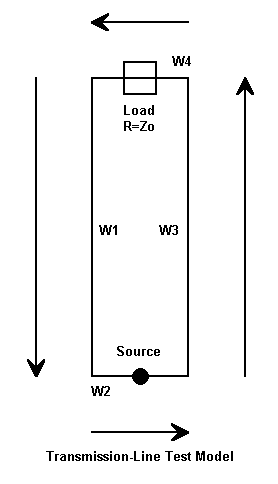
The following table shows the results of using the arrangement with a carefully adjusted 1/4 wavelength line of #14 AWG copper wire at 14.15 MHz (210"). Theoretically, the source impedance should be the same as the load resistance only when both are equal to the line impedance, according to the standard 1/4 wavelength line equation:

where Zo is the characteristic impedance of the line, Rl is the load resistance, and Zs is the reported source impedance, all in Ohms.
First, there is a small and uneliminable reactance at the source from the test model. Second, the wires are very close together, approaching the limits of NEC-4 to handle, even when segments are carefully paralleled. In all cases, the modeled impedance is higher than the calculated impedance by from 5% to 7%.
Line Zo        Wire      Spacing   Modeled Zo     New Wire
Calculated     Dia.      (inches)  in Ohms        Size for Zo
600            0.064"    4.78"     635            0.086"
450            0.064"    1.37"     483            0.084"
300            0.064"    0.39"     316            0.075"
All results used segments lengths equal to the wire spacing. As the segment lengths were lengthened, the 600-ohm line was least affected, but the 300-ohm and 450-ohm lines changed values for each new segment length tried--without a definitive pattern. As the segment lengths increased, the far field from the test model increased from nearly -40 dBi to values in the low 30s.
Increasing the wire size brought the line impedance close to the calculated value. Equally, one might widen the spacing.
NEC-2 results with the same models correlated well with NEC-4 results with segment lengths greater than 0.005 wavelength. With shorter segments, the two programs apparently respond somewhat differently to closely spaced wires. Tapered-length transmission line models correlated well between the two programs, especially in the 450-ohm to 600-ohm Zo range.
For many applications, the exact line impedance may be unimportant. However, when physically modeling lines where their impedance does make a difference, running a test model to determine the line Zo is recommended. Physical models of transmission lines are at best somewhat cumbersome. However, they are important to any application where the lines may experience unequal currents and therefore radiate. Typical of such applications is the off-center-fed wire antenna. Comparing the far fields (including both vertical and horizontal components) of the antenna alone and the antenna with its parallel feedline will provide an estimate of such things as the field shape modification occasioned by the feedline, any change of elevation angle of maximum radiation, and any far-field gain changes. An examination of the currents along the transmission line may also be useful in determining the degree of unbalance occasioned by the off-center feed point. Similar exercises may prove useful with other antenna types.
Within their limitations, physically modeled parallel transmission lines can provide useful information, even if in some cases exactitude is sacrificed. To date, I have found no useful technique to model physically a coaxial cable such that the cable model fits within the segmentation limitations of versions of NEC aimed at radio amateurs.
In exchange for this limitation, the modeler acquires the ability to place one or more transmission lines into the model. The lines may have any Zo and any velocity factor. Moreover, the transmissions lines do not add to the total wire and segment count. For a given antenna structure, core runs will be faster. Alternatively, where there is a limit to the number of segments allowed by a program, more segments are available for detailing the antenna structure itself.
Transmission lines inserted via the TL input will be treated as lossless. Consequently, if line losses are significant to the analysis, they will have to be separately calculated via a program such as Dean Straw's TL.
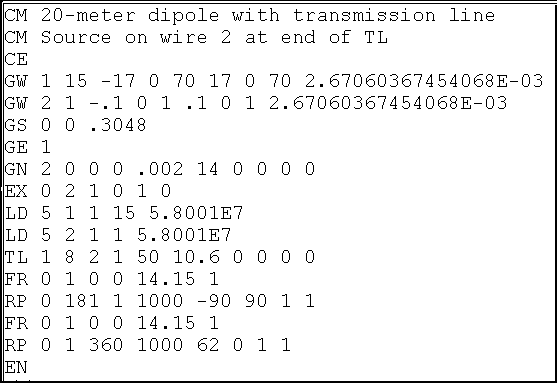
The figure shows the NEC input file for a simple 20-meter dipole with a transmission line running from the antenna's normal feedpoint to another point used as the source. The terminating point of a transmission (as well as the starting point) must be a wire. When dealing with transmission lines used to feed an antenna, the "other wire" may be a very short single segment wire. Wire 2 in the sample is the terminating wire for the transmission line. It is only 0.003 wavelength long. The reason for keeping such wires very short is to ensure that they are minimally affected by the main antenna field and likewise minimally affect that field. For most amateur purposes, keeping the current on the secondary wire to 0.1% of the highest level of current on the antenna structure is sufficient to safeguard the accuracy of the reported antenna performance results.
The actual transmission line is specified on the line marked TL. The significance of the entries is as follows:
     TL    1     8      2     1    50   10.6   0    0     0    0
        1st End Seg. 2nd End Seg.  Zo  Length Real Imag. Real Imag.
         Wire #  #    Wire #  #   Ohms meters Adm. Adm.  Adm. Adm.
                                               W1 shunt   W2 shunt
The input entry tells us that the transmission line runs from segment 8 (the center) of wire 1 to segment 1 of wire 2. The Zo is 50 ohms. If the entry had been -50, the negative sign would indicate to the program to cross or reverse the terminals at the far end. The length is 10.6 meters, about 1/2 wavelength at the test frequency of 14.15 MHz. Note that there is no provision on the input line for a velocity factor. Any input system that permits entry of a velocity factor precalculates the length of an equivalent line with a velocity factor of 1.0 and enters that figure in the length place.
The last four places are for shunt admittances containing conductivity and susceptibility factors for ends 1 and 2 of the transmission line. We shall not use them in this exercise.
Note also that the distance between the two wires specified in the GW, or wires, entries is 69 feet. However, the length of the transmission line used in calculations will be the one specified in the TL card unless a zero is entered for length. In that case, the program will use the straight-line distance between the two terminating points of the transmission line as the line length. This latter entry capability is useful for placing straight line phasing lines between fixed elements and similar applications.
NEC-Win Basic and the Basic module of NEC-Win Pro use a special window to simplify data entry:
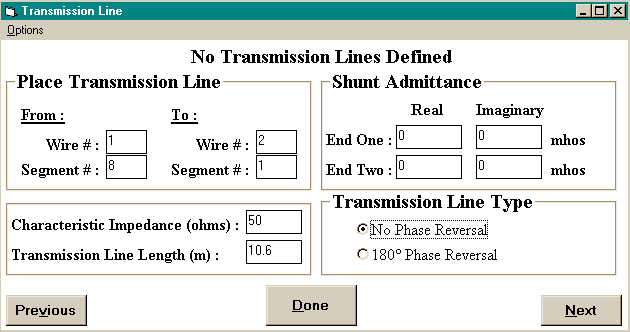
Although the label says, "No Transmission Lines Defined, this window shows one in the process of being defined. The terminating points are defined in the upper left, while the Zo and Length are immediately below. Note again that there is no provision for a velocity factor: the line length for a VF of 1.0 must be precalculated by the user. In the lower left is an entry to specify phase reversal or normal connections, with the unused shunt entries immediately above.
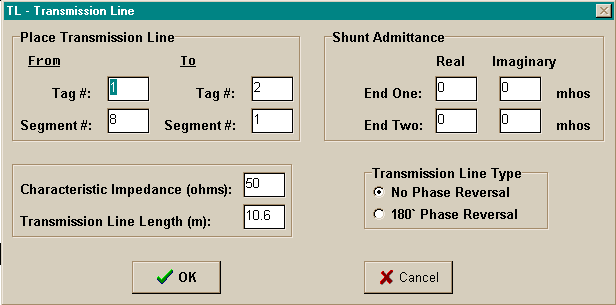
NEC-Win Pro also accesses a similar window from the TL line of the antenna description. Although styled slightly differently, the data entry scheme is identical to the one just described.
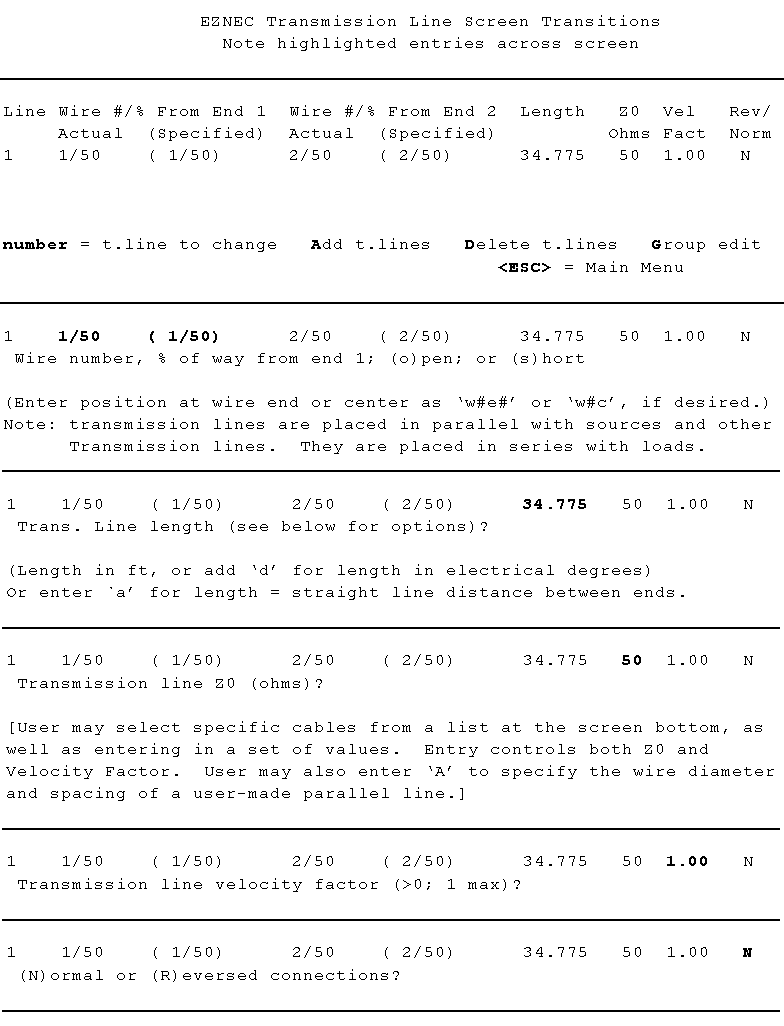
EZNEC enters transmission lines on a separate page, somewhat similar to the one used for loads. The partial replications in the figure take you through the transitions as you move from one item to the next in creating a transmission line. The top section shows the complete data entry, ready for revision, if one chooses to do so. The remaining partial screen section change as the user highlights one item after the other.
The second screen appears when either end of the transmission line is illuminated. The next screen highlights the length, which in EZNEC is entered in the same units as the wire dimensions. In this case, it is feet. If the user specified the length with a "d" suffix, the entry is interpreted as electrical degrees, which is then calculated into meters for the NEC core. Be careful not to use electrical degrees for a frequency sweep designed to show the properties of a fixed length of transmission line over an amateur band. An entry of "a" for the length will use the straight-line distance between the specified wire segments as the line length.
When either the Zo or the velocity factor are illuminated, the user has the option of selecting a transmission line from a table of both coaxial cables and parallel lines. Alternatively, the user can enter the required values. Finally, the user can construct an air-insulated parallel line by supplying the wire diameter (in measured units or as an AWG value) and the wire spacing.
The normal-reverse flag is activated in EZNEC by specifying N or R as the final line entry.
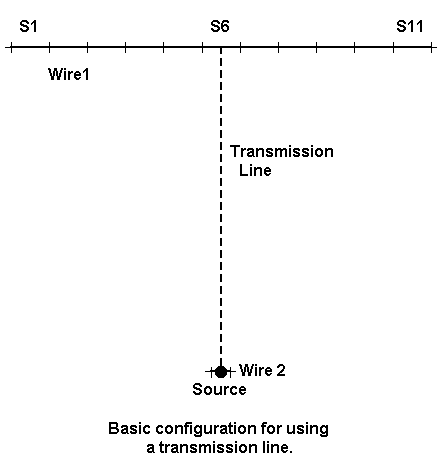
Although the figure shows 11 segments, the antenna wire can have any (odd) number of segments (if a true center connection is desired). The second wire is very short and has one segment. The transmission line goes from the center of one wire to the next.
Consider a 20-meter dipole similar to the one in the figure, but with 101 segments of #14 copper wire. The total length is 33.696' (5.141 m). The second wire is 0.02' (0.006 m) long and has 1 segment. (This length at the test frequency of 14.15 MHz is about 0.0003 wavelength long, while the recommended NEC-4 minimum wire length for such applications is about 0.0001. For NEC-2, the wire should be at least 0.001 wavelength long.)
The NEC-4 source impedance of the antenna alone is 73.06 - j0.01 ohms. Now let's do a familiarization exercise based on the fact that a lossless feedline repeats the antenna source impedance every multiple of 1/2 wavelength. First, we move the source from the long antenna wire to the short second wire. Then, we specify a 50-ohm, VF=1.0 transmission line between the center of the antenna (the former feedpoint or segment 51) to the center of the second wire.
Since TL-type transmission lines are in parallel with sources, the effect of placing both the source and the transmission line on the second wire is to place a source in series with each wire of the transmission line, just as we would model the system physically. Except for the fact that the TL- type transmission line will not even show copper wire loss, the results will be identical for physical and TL transmission lines.
For example, let us assign to the transmission line a length that is exactly 180 electrical degrees. The resulting reported source impedance will be 73.06 - 0.08 ohms in NEC-4. (As with all models in the exercises in this series, minor adjustments will have to be made for NEC-2, adjustments that are only apt to yielding the excessively precise outputs used for numerical comparison, but which have little or no practical application to real-world antennas.)
EZNEC permits the specification of transmission line lengths in electrical degrees (and automatically specifies a velocity factor of 1.0). For other programs, we may have to calculate precisely the length of the transmission line that is exactly 180 electrical degrees long at the test frequency. At 14.15 MHz, this length is 34.7552' or 10.593 m. Using either of these values, the source impedance reported is the same as just noted.
Now let us substitute a truer 50-ohm coaxial cable, perhaps RG-213, with a velocity factor of 0.66. The requisite length of the cable is simply 0.66 times the value used with the assumed velocity factor of 1.0, or 22.9384' (6.9914 m). Using this transmission line, the reported source impedance is 73.06 - j0.00 ohms.
A real coaxial cable, even brand new, will not deliver lossless performance. If we use a program like TL, we shall discover that RG-213 at the specified length of nearly 23' (nearly 7 m) with an antenna impedance of 73.06 - j0.01 ohms will show that the source end an impedance of 71.91 - 0.03 ohms. This value represents the apparent SWR decrease (from 1.46 to 1.42) due to line loss with which most antenna users are familiar. The line also creates a 0.195 dB power loss, which amounts to 4.4%. The loss is a combination of basic line loss plus the additional loss due to the SWR level.
There is no convenient way to incorporate this loss into the antenna wire at either end of the model. Nor should we want to. Whatever the power delivered to the antenna, its gain and other characteristics remain constant (assuming that material junction losses can be neglected). If the losses and gains within an overall antenna-plus-transmission line-plus- source system are important, they can easily be calculated externally to modeling the antenna itself.
This exercise has little practical value other than familiarizing the modeler with the placement of TL transmission lines within a model. The model used here can be extended by changing the length of the transmission line in increments of 10 electrical degrees and observing the change in source impedance across a full half-wavelength. One might also use 300-ohm and 450-ohm transmission lines in order to observe the greater excursions of resistance and reactance with each 10-degrees of electrical length. All of these are familiarization exercises, designed to develop a set of reasonable expectations for models employing TL transmission lines.
In each case, we must remember that the values given are for a lossless line. The TL transmission line will return the same value of source impedance for 0, 180, 360, and 540 electrical degrees, or multiples of 34.7552' (10.593 m) for velocity factors of 1.0. For comparison, run each length through a program such as TL to determine the losses for each length and the anticipated impedance presented at the source end of the line.
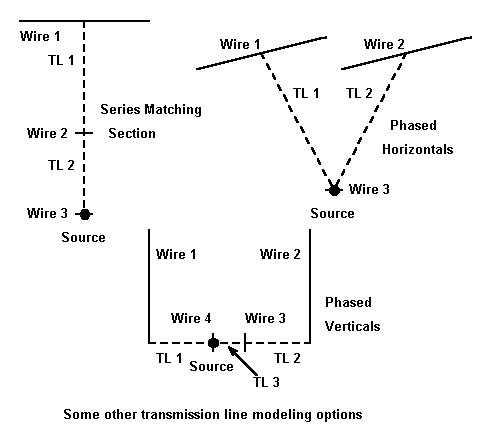
At the upper right is a pair of horizontal antenna elements spaced some distance apart. The spacing might be anything from 1/8 to 1/2 wavelength. We may feed the antennas either in phase or out of phase. To explore the various situations, we need only create a third wire. Then we create transmission lines from wire 1 and from wire 2 to wire 3, where we also locate the source. In order the reverse the phase of feeding, we simply specify one of the two transmission lines as "reversed" or "180-degree phase reversal," which enters a minus sign in front of the Zo we specify for the two lines. We can even experiment with different Zos for the transmission lines and different lengths. The models, even though subject to slight inexactitudes due to the lossless nature of the transmission lines, will teach much about phasing lines with a common feed point.
At the bottom is the KB8I phasing system for feeding two 1/4 wavelength verticals that are spaced 1/8 wavelength apart. TL1 and TL2 are 50-ohm coaxial cables 157 degrees long, each terminating with a wire in the model. Between the wires is another cable, TL3, which is 29 degrees long. To create this model, we might place the verticals over perfect ground. If we wish to model over real ground, we would elevate the verticals and their ground planes for NEC-2. In either event, wires 3 and 4 should be elevated. There are methods for calculating the phasing lines to achieve a desired current phasing of -135 degrees for one of the verticals with the other at zero degrees, giving a broad, nearly cardioidal pattern to the array. Of course, we can replicate Al Christman's dual directional array switch simply by moving the source from wire 3 to wire 4 and back again. For this array, which permits a direct 50-ohm coaxial cable feed from the model source to the shack, it is wise to look at the current magnitude and phase at the based of each antenna as well as the overall current and source impedance. You might even wish to experiment by replacing the 50- ohm cable with 75-ohm cable, just to see what happens. Be sure to remember to calculate for the velocity factor when translating the cable lengths in electrical degrees into feet or meters.
At the upper left is an interesting system for improving the operating 2:1 SWR bandwidth of an antenna-feedline system for dipoles. This can be operationally important to amateurs using gear with sensitive SWR shut-down systems with certain antenna situations. Consider a half-wavelength center-fed dipole for 40 meters, which we might model as #14 copper wire 67.2' long with 101 segments. Let us place this antenna at a height of 50' above medium earth. We would obtain the following values of source impedance and 50-ohm SWR from NEC-4:
Freq.    7.0     7.05    7.10    7.15    7.2     7.25    7.3
R        83.28   84.88   86.44   88.07   89.72   91.38   93.06
X        -32.5   -21.3   -10.1   - 0.9    12.0    23.0    34.0
SWR      2.03    1.85    1.76    1.76    1.84    1.99    2.19
Even allowing for the lower SWR that appears at the shack end of the line due to line losses, the band edge values may activate power reduction circuitry in some gear. As a step toward resolving the problem, let us create a short wire spaced well away from the dipole. From the antenna, run a 50-ohm coaxial line exactly 1/2 wavelength long at the band center, 7.15 MHz. RG-213, with a velocity factor of 0.66, would be 45.40' long for this application. Be sure to move the source to the new wire (wire 2 in the diagram). Because the transmission line is less than 1/2 wavelength long at 7.0 MHz and longer than 1/2 wavelength long at 7.3 MHz, we obtain the original feedpoint impedance only at the band center, 7.15 MHz. At other frequencies across the band, we obtain the following values for the lossless line:
Freq.    7.0     7.05    7.10    7.15    7.2     7.25    7.3
R        90.09   87.80   87.13   88.07   90.58   94.75   100.8
X        -27.1   -17.3   - 8.0     0.9     9.5    17.9    26.0
SWR      2.03    1.85    1.76    1.76    1.84    1.99    2.19
Note that the SWR has not changed, but the impedance values have, except for mid-band. The resistive component has gone up, and the reactive component has gone down. In fact, the values are sufficiently higher than 50-ohms to make a 1/4 wavelength 75-ohm matching section useful to transform them to lower values. So let's add a new short wire (wire 3) and move the source to it. Then let's create a 75-ohm, 0.66 velocity factor transmission line from wire 2 to wire 3. The line will be 22.70' long. From it--again allowing for the fact that the model uses lossless line--we obtain the follow source values:
Freq.    7.0     7.05    7.10    7.15    7.2     7.25    7.3
R        56.45   61.26   63.92   63.86   61.31   56.96   51.72
X         16.0    11.5     5.6   - 0.7   - 6.2   -10.1   -12.2
SWR      1.38    1.34    1.30    1.28    1.26    1.26    1.27
The result is a set of SWR values across 40-meters that should satisfy any piece of amateur equipment. The line losses at any point in the band may be calculated from TL and compared to the use of a single 50-ohm cable or to the use of a single 75-ohm cable with impedance transformation (and network losses) at the shack. There is not likely to be a significant difference.
For developing the general picture of what occurs all across the band with this system of matching, modeling both the antenna and the transmission lines provides one of the most efficient methods. I am indebted to Dave Leeson, N6NL, for bringing the matching system to my attention. Dave attributes it to Frank Witt, AI1H and other sources. All in all, it provides a good exercise in seeing the modeling capabilities of NEC in handling multiple lengths of transmission line on the way from the source to the antenna.
Not all transmission lines must have a short wire at one end. Consider the following sketch of a ZL Special. Pioneered, although apparently not invented, by George Prichard, ZL3MH (later ZL2OQ), the antenna consists of two elements spaced about 1/8 wavelength apart. The feedpoint is the junction of the forward element and the phase line (transmission line) to the rear element.
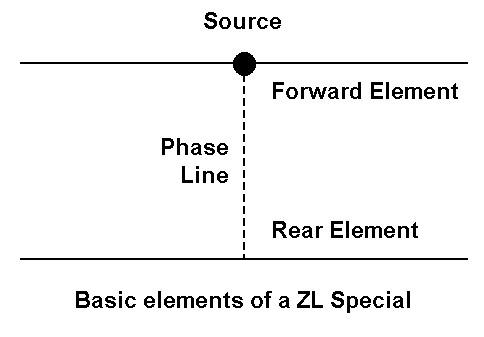
Let's build one of these antennas as a model. For 28.5 MHz, we might choose 3/4" diameter aluminum tubing and make two identical elements, each 16' long with 51 segments. We shall space them 3.46' apart, which is just about 0.1 wavelength. We shall set one element as the forward element and place the source at its center. We create the phasing line by placing a transmission line between segments 26 of each of the two elements. Let us follow Prichard's lead and use 71- ohm parallel line, which had a reported velocity factor of 0.67. Let's be sure to place the traditional half twist in the line by reversing the phase. If we place the antenna at 35' above medium earth, NEC will return a gain of about 11.8 dBi, a front-to-back ratio of about 25.7 dB, and a source impedance of about 7.2 + j8.8 ohms. (The low source impedance did not bother Prichard, since he fed his arrays with parallel feeders and an antenna tuning unit.) These facts are perhaps the least interesting in connection with the ZL Special.
Now let's examine the current tables available as an output from NEC. If we used a current source of 1 for the antenna, we shall find the current at the center of the forward element to be about 0.455 at -16.69 degrees. At the center of the rear element, we find the current to be about 0.462 at 159.78 degrees. The rear element has a magnitude of 1.015 and phase of 143.09 degrees relative to the forward element. Yet, the phase line length was only 0.1 wavelength long physically and 0.15 wavelength long electrically. How is this possible?
To find out, let's make a slight change in the model. If the forward element was modeled from left to right (-8.0' to +8.0'), then let's make the rear element in the reverse direction (+8.0' to -8.0'). Next, let's change the transmission line back to its normal or non-reversed orientation.
When we run this model, we obtain identical performance figures to those cited above. However, the current tables show another story. The forward element remains as it was, but the rear element shows a center current of 0.462 at -20.22 degrees. The rear element is -36.91 degrees relative to the forward element, which is equivalent to a phase angle of 323.15 degrees. Of course, subtracting 180 degrees from this figure yields 143.15 degrees, which we obtained from the first version of the model.
The current phase change of (-)36.91 degrees along the 71-ohm, 0.67 VF phase line of 3.46' from the rear element to the forward element is precisely what we need to provide the two elements with the relative current magnitude and phase angles so that the array achieves a front-to-back performance far in excess of what a similar driven element-reflector Yagi might obtain with the same spacing. The details of the analysis of ZL Specials go way beyond our purpose here, but the ZL Special is an excellent example of modeling transmission lines between two elements.
There are numerous other feedline uses of feedlines, but these examples
should get you started. We may also use feedlines for other
things, for example, as substitutes for lumped components. However, that
set of applications will require that we search for shorted and open lines,
and they can only be found in the next part of this series.
Updated 12-28-97. © L. B. Cebik, W4RNL. Data may be used for
personal purposes, but may not be reproduced for publication in print or
any other medium without permission of the author.