
 A 10-Meter LPDA
Note: the original design criteria required that we develop an LPDA for 10 meters that would cover the band with a. roughly equivalent gain to a short boom (8') Yagi, b. have at least 20 dB front-to-back ratio across the band, and c. have a low 50-Ohm SWR across all of 10 meters, d. all on an 8' boom. The basic monoband LPDA design uses 4 elements.
To investigate the questions relating to element diameter and the length- to-diameter ratio, I used LPCAD to design an antenna with input frequency limits of 28 and 30 MHz. I chose this design frequency span knowing that it was not the optimum for thinner elements, but that it would grow more optimal as the element diameter increased. Regardless of element diameter, the program yields the same set of element specifications:
Element Length (")       Cumulative Spacing (")
     215.074                  00.000
     192.584                  35.592
     172.445                  67.462
     154.412                  96.000
For element diameters of 0.5" through 1", the dimensions yielded the following length-to-diameter ratios for the longest and shortest elements:
Diameter (")        0.5       0.625     0.75      0.875     1.0
L/D (longest)       430.1     344.1     286.8     245.8     215.1
L/D (shortest)      308.8     247.1     205.9     176.5     154.4
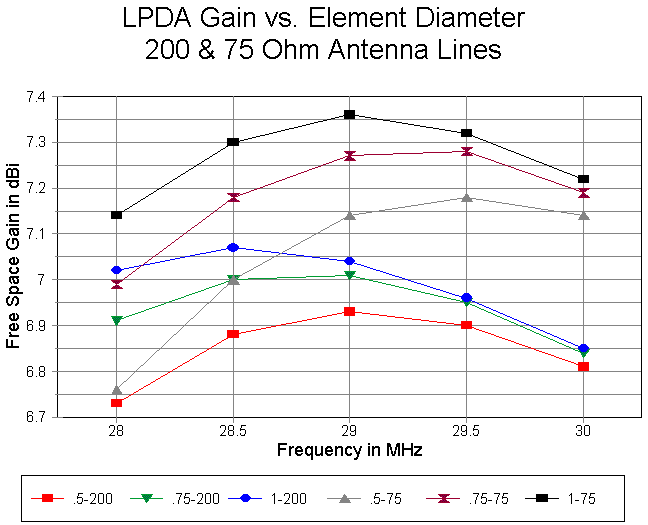
The gain graph compares 3 diameters of elements for the 200 and the 75 Ohm lines, both with VFs of 1.0. For any given diameter of element, the low- impedance antenna transmission line provides higher gain by a significant amount. The 200-Ohm line models all peak low in the band and decrease in value at the upper end, except for the 0.5" diameter model, whose curve is fairly symmetrical. The 75-Ohm line models show that, for thinner diameters, the gain peaks are in the upper portion of the band, with a rough symmetry being achieved with the largest (1") element. The superiority of the low-impedance antenna transmission line with respect to gain is a clear result.
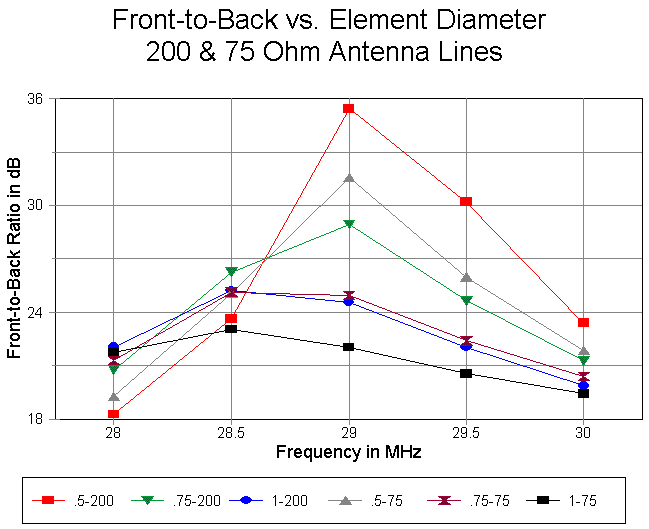
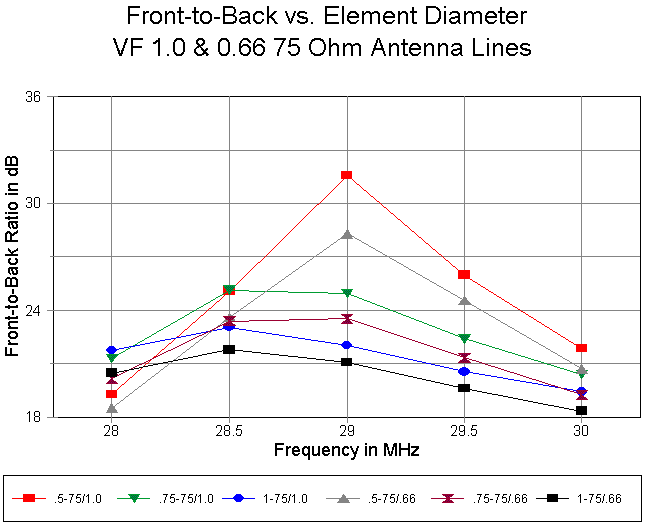
The front-to-back results, using the same sampling of models, present a somewhat more confusing graph that must be tracked almost a line at a time. However, two of the three lines showing high peaks at 29 MHz represent 200- Ohm line models, with the thinnest element (0.5") showing the highest peak. The largest element (1.0": blue line)) shows almost no peak, but reaches it highest value just above 28.5 MHz. The thin-element lines show their lowest values at 28 MHz.
In contrast, the three 75-Ohm line models display much "tamer" curves with no sharp peak, except for the 0.5" diameter element, which also shows a value of less than 20 dB at 28 MHz. Larger elements with a low impedance line provide higher front-to-back ratios at the low end of the band and lower values at the upper end of the band. The 1" element barely sustains a 20 dB figure at the 29.7 MHz upper limit of 10 meters.
The higher gains associated with a low impedance line come at the cost of lower average front-to-back ratios. However, the front-to-back curve for the low-impedance line is much more nearly constant across the band.
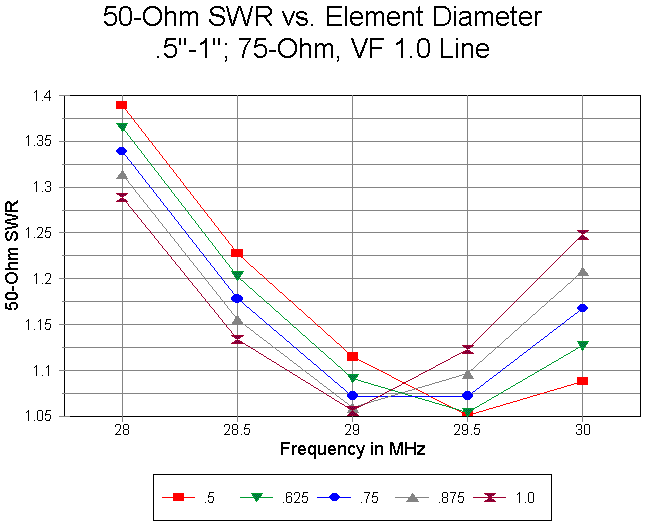
The direct-feed 50-Ohm SWR curves for the low impedance line, with a VF of 1.0, form a well-behaved group of curves. As the element diameter increases, the lowest SWR frequency become lower, falling in the center of the band at an element diameter of 1". This placement is a fairly clear indication that the element diameter is approaching a value for which the calculation software has been optimized.
The curve appears to be much steeper at the low end of the band. However, be certain to read the Y-axis values, which only peak at an SWR of 1.4:1.
To this point, I have recorded none of the values associated with a low- impedance line with a VF of 0.66. In general, the gain and front-to-back values are lower than those for the same line with a VF of 1.0.
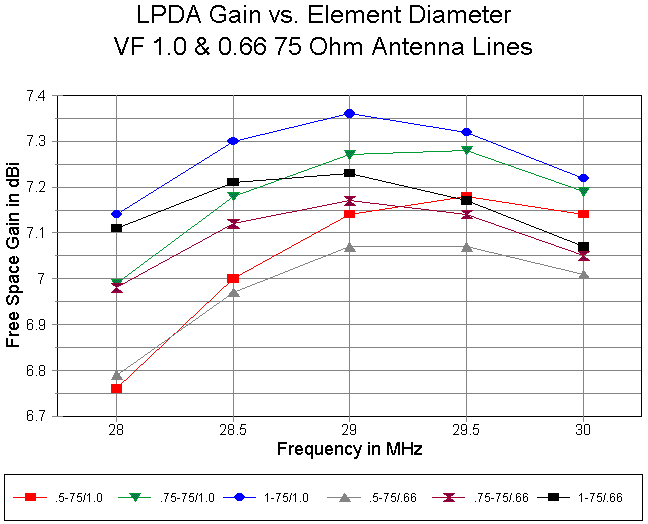
If you pair elements with the same diameter but different values of VF and trace the corresponding lines (red to gray, green to brown, and blue to black), you can see that the gain of the VF=0.66 line tapers off rapidly as the frequency increases. However, the gain at the lower end of the band is higher for the VF=0.66 line than for the VF=1.0 line in each pair.
The gain curves for the two values of velocity factor show different curves. In contrast, the front-to-back curves are congruent for each pair of maodels having the same element diameter. The VF=0.66 lines show a consistently lower value for the front-to-back ratio throughout the sequency of models.
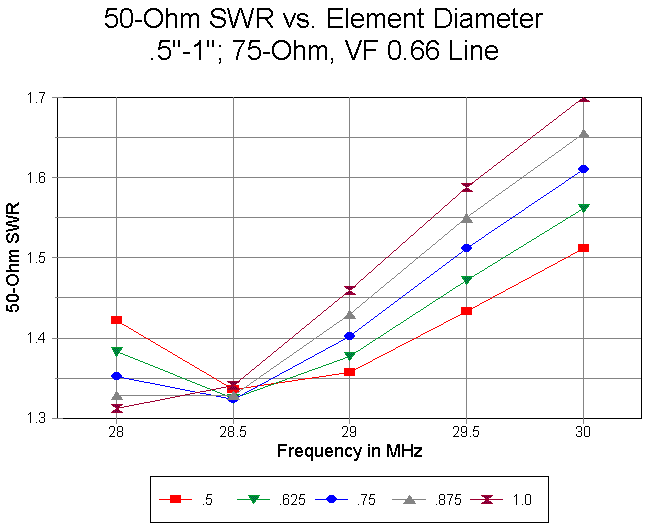
The figure above records the SWR values using the 0.66 VF line, all of which climb above 28.5 MHz. Although the upper limit is not disastrous, being still below 2:1, the curve does show an increasing upper band limit SWR as the element diameter increases.
The conclusion reached earlier in these investigations was that a VF of 0.66 had no great impact on antenna performance. This conclusion, it now appears, holds true only for thinner elements, including the 0.5" diameter element used in that phase of the study. As the element diameter is increased, the velocity factor has an increasing affect--mostly adverse--on the monoband LPDA performance.
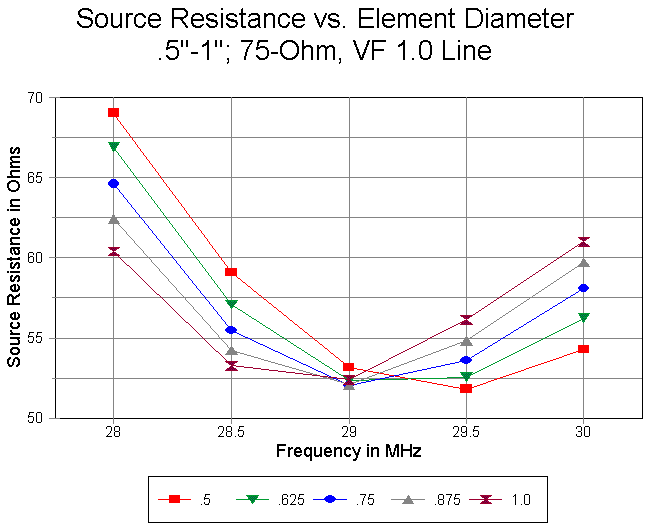
To get some understanding of why the velocity factor of the low impedance line almost reverse the SWR curves when going from 1.0 to 0.66, it may be useful to look at curves for the source resistance. The graph above records the results for a VF of 1.0. As the element diameter increases, the lowest value of source resistance moves downward in frequency. At a size of 1", the resistance curve is nearly perfectly symmetrical, with end values just above 60 Ohms at both ends of the band. The reactance values at the band edges are both under 10 Ohms (capacitive).
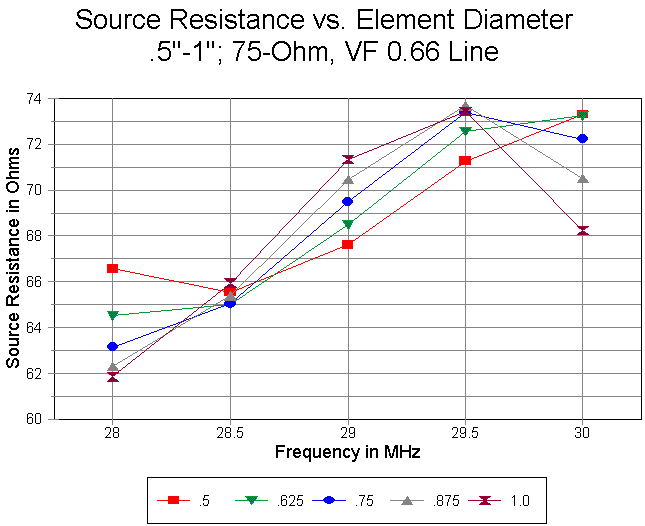
With an antenna transmission line of 75 Ohm, but with a VF of 0.66, the source resistance shows values in the 60s only for 28 and 28.5 MHz. All frequencies above these show higher source resistance values. Thinner elements show their peak value at 30 MHz, while the three largest diameters show a peak at 29.5 MHz. Although the capacitive reactance at the low end of the band is under 10 Ohms or so, the capacitive reactance at the upper end of the band can exceed 25 Ohms.
As noted with the SWR curves, the increase in both resistance and reactance at the upper end of the band for this monoband LPDA are not specifically prohibitive. However, if an alternative to common lines have a VF in the 0.66 range can be found, its use is advisable, especially since the poorer SWR performance is also reflected in poorer gain and front-to-back performance as well.
The initial conclusion that seems inherent in these modeling exercises is that fat elements and a low impedance, high VF antenna transmission line are preferable to thin elements and a high impedance antenna transmission line. Each factor adds about 0.25 dB to the antenna gain potential, as well a promising a flatter SWR curve.
Of course, with the higher impedance line, a matching section can be devised to provide a very flat SWR curve. However, that line will not change the lower gain of the array relative to the same array with a low impedance line. Fat (1.0") elements elevate the gain of both types of arrays by about the same amount. However, the upper band-end gain of the low-impedance line model is better sustained than with the high-impedance line model. Hence, fat elements and a low impedance, high VF line seem the optimal conditions for the monoband LPDA.
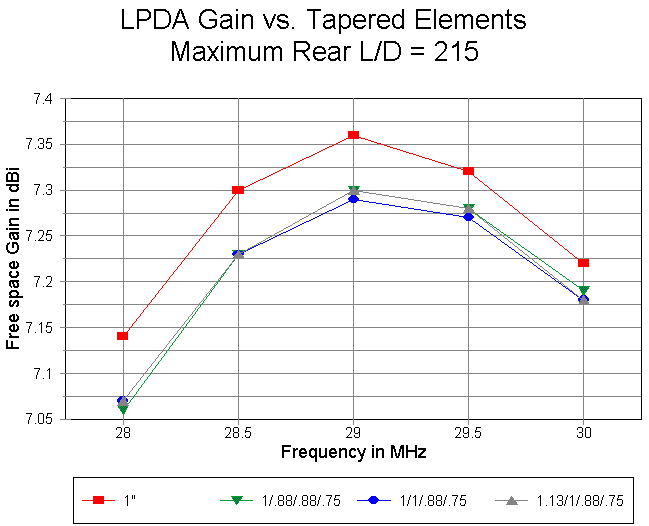
The gain figures for the three tapered element models-with the constant 1" diameter model used for comparison show why I ended the progression. All models are for a 75-Ohm, VF=1.0 antenna transmission line. The three tapered diameter element models show virtually the same gain at all frequencies--and all three are below the values obtained with the 1" diameter element model.
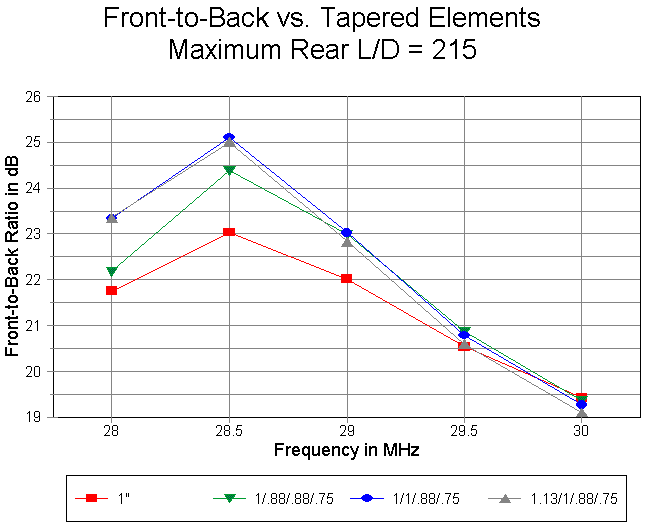
With respect to front-to-back ratio, the tapered element models show a peak at 28.5 MHz, with the two more highly tapered models showing the highest peak. However, all of the curves, including that of the 1" diameter element model, become coincident at about 29.5 MHz. Whether the region of higher peak front-to-back compensates for an overall lower gain is a question with no immediate answer.
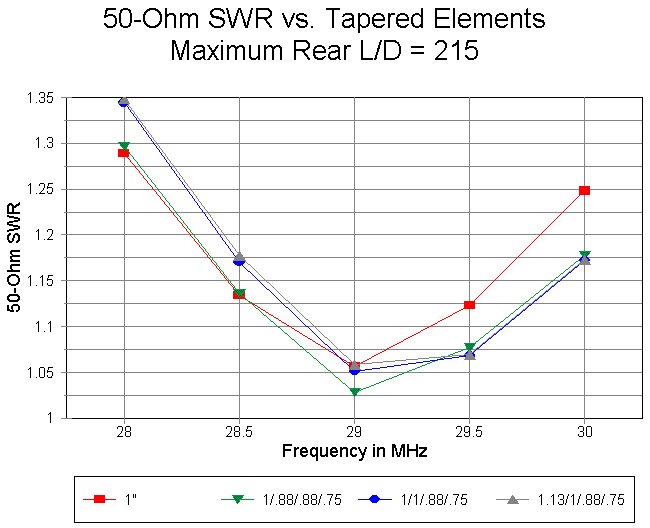
With tapered elements, one might well expect a shallower SWR curve at the upper end of the band, and the graph above fulfills that expectation. However, the amount by which any of the tapered element model curves is superior is too small to constitute a reason, in and of itself, for opting to taper the diameter of elements.
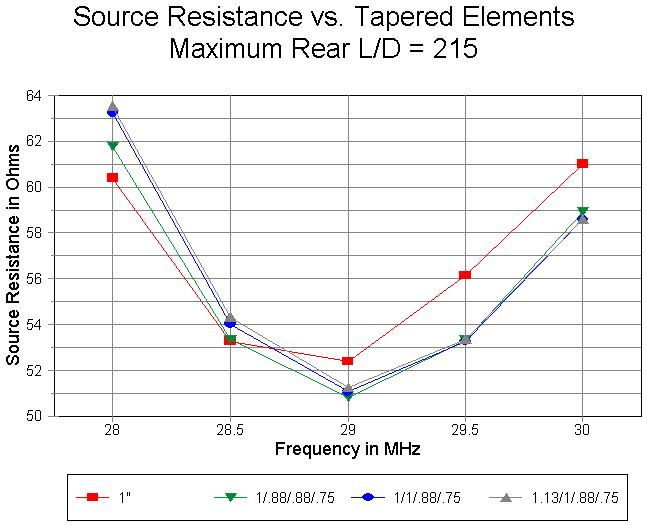
The source resistance curve for the tapered diameter models also shows a very slight improvement over the 1" constant diameter model. Once more, the degree of improvement is so small that the loss of gain in the process may count against moving in this direction.
The upshot of the exercise is the conclusion that the electrical performance of a monoband LPDA is not significantly affected by the use of element that have different diameters from front to rear. Unless there are mechanical reasons for developing a monoband design in this direction, a constant-diameter model will provide essentially the same overall performance and is at least conceptually simpler.
This conclusion, of course, applies only to a monoband LPDA. The results obtained with wide-band LPDAs may differ.
In fact, our thinking must be spherically 3-dimensional, and once we make that shift, the answer to the question of where the gain comes from becomes straightforward. It comes from everywhere else on the sphere except the 180-degree line running through the array.
One of the indicators is the -3 dB beamwidth figure, when taken in both the E-plane and the H-plane of the antenna in free space. If we cannot get more gain from the rear, then we would normally have to have narrower beamwidths in one or both directions--in short, a more focused forward lobe.
In our models, we have optimized a wire LPDA using 27 and 29 MHz as the input frequency limits. The result is a gain peak at 29 MHz. A similar peak resulted when we optimized an LPDA with 0.5" elements, using 27.5 and 29.5 MHz as the input limits. Finally, we obtained a third 29 MHz gain peak with 1" diameter elements using 28 and 30 MHz as the input limits. (The last example shows a gain peak variance when using a 200-Ohm antenna transmission line, but is otherwise consistent with the other models.)
The following table provides some comparative data for these antennas at 29 MHz using both 200-Ohm and 75-Ohm antenna transmission lines with VFs of 1.0.
Antenna/       Gain dBi       F-B dB         E-plane   H-plane
 ATL                                         BW-deg    BW-deg

#12/200-Ohm    6.45           19.45          68.4      131.8
#12/75-Ohm     6.62           19.71          67.4      127.6

0.5/200-Ohm    6.88           30.37          67.8      125.0
0.5/75-Ohm     7.15           26.24          66.4      119.0

1.0/200-Ohm    7.04           24.56          67.6      122.2
1.0/75-Ohm     7.36           22.01          65.8      115.4
Clearly, the gain does not come solely from one plane, but from the overall beamwidth on a spherical surface. (For example, the #12/75 model has the second lowest gain of the group, but its E-plane beamwidth is only 4th widest.) As a rough gauge (but certainly not a definitive one), the rank order of gain figures is also the inverse rank order of the products of the E-plane and H-plane beamwidths.
Although indicative of the source of the LPDA gains, the analysis is quite incomplete, since all points on the sphere would have to be considered for a complete analysis. The rear lobe patterns show considerable variety, so that the 180-degree front-to-back figures can be equally useful or misleading in figuring the gain sources. Nonetheless, for the case at hand, the -3 dB beamwidths are sufficient indicators of how the LPDA models can simultaneously increase their forward and rear gain levels.
El. Dia.       El. #                    Current
inches                        Magnitude                Phase
                              (relative to 1.0)
1.0"           1              0.53                       10.6
               2              0.89                     - 79.1
Efficiency     3              0.94                     -168.1
99.7%          4              0.55                      109.6

0.5"           1              0.48                       10.6
               2              0.85                     - 81.3
Efficiency     3              0.88                     -168.4
99.5%          4              0.47                      110.4

0.08"          1              0.44                       12.6
               2              0.80                     - 86.2
Efficiency     3              0.75                     -165.6
98.4%          4              0.32                      110.4
Although there is a fairly tight correlation among the current phase values for corresponding elements, the decrease in magnitude across the span of models with decreasing wire sizes is clearly apparent. Since the phase line is identical in all three cases, the slight spacing difference among the models (of the order of 0.1") is not sufficient to account for the differentials of current magnitude on the basis of different amounts fed to each element.
Mutual coupling is the second source of element current. In the case of these models, the mutual coupling is directly dependent upon the wire size as well as spacing, and--given the relatively constant spacing between corresponding elements among the models--the wire size difference is sufficient to increase or reduce quite noticeably the level of current induced by and in the wires of the array. For corresponding wires, elements 1 and 2 show a magnitude difference across the span of models of about 0.1, while wires 3 and 4 show total differences in the 0.2 range. Given the wire sizes (which are all quite large in terms of basic wire loss), the differential is mostly a matter of basic element diameter and surface area and not of material losses in the elements. The forward gain differential among the arrays does not indicate power gained or lost by the antenna as a whole, but--as noted in the preceding section--power spread narrowly or less narrowly in the forward beam of the array.
Like the analysis of gain source, this account is indicative, but by no means complete. Looking at the current magnitudes and phase changes all along the elements would be necessary for a complete picture of the role of each element in each array. Nonetheless, even a cursory glance at model current tables can provide a wealth of information about an antenna's operation.
For elements that are large enough--for example, 1" diameter as a practical limit--element diameter improves both spot and overall LPDA performance more than tapering the element diameters to achieve a constant L/D ratio. (Note especially that this conclusion is true of the monoband LPDA and may not hold for wide-band LPDAs.) Although the original small-diameter element model provides acceptable performance in terms of the original conditions of this exercise, the 1" element model provides the highest gain level and the flattest SWR curve. The front-to-back ratio is reduced on average, but remains above 20 dB across the 10-meter band in a curve without a sharp peak.
The fat-element model is most effective with the low-impedance antenna transmission line having the highest possible velocity factor. The gain of the 1" element model is about 0.25 dB higher than the 0.5" element model, using uniform-diameter element models.
The question that remains is whether the quarter dB added gain is a seduction or an asset. It is an asset if it can be implemented in a mechanically sound design that can be replicated in the average garage. The result should not be very much heavier than a 0.5" diameter element model and should be able to slip or withstand about the same wind forces. Half-inch diameter elements offer a light but sturdy structure of proven durability.
Likewise, the low-impedance antenna transmission line offers higher gain and a direct 50-Ohm feed. However, those advantages are offset a bit by the possibility of a steeper SWR curve across the band compared to the use of a carefully cut matching section applied to a 200-Ohm antenna transmission line. The latter is capable of providing a very flat SWR curve, even though the higher impedance antenna transmission line shows reduced gain.
Note also that the fat-element and low-impedance line effects are cumulative--up to nearly a half dB in the gain column, when comparing 0.5" and 1" diameter elements. Consequently, it seems desirable to achieve, if not both, then at least one out of the two goals.
So the questions facing this design project, if it is to achieve the highest possible monoband LPDA performance, are two: 1. Can a 1" diameter element version of the antenna be practically implemented? 2. Can a high- VF 75-Ohm antenna transmission line be fabricated so that it is light and sturdy?
Of the two questions, perhaps the second is the more interesting, since it
requires the most investigation. However, at this stage, I need to use
special care to ensure that I am not simply succumbing to a predilection
for thin-element construction. The antenna diameter question also needs
careful weighing.
Updated 11-14-98. © L. B. Cebik, W4RNL. Data may be used for
personal purposes, but may not be reproduced for publication in print or
any other medium without permission of the author.