
 Some Model Quads:
Rarely is the modeling of a quad beam just an exercise. The modeling activity generally precedes some decision-making about building or purchasing an actual antenna. Hence, we cannot proceed without encountering various kinds of controversies.
In this episode, we shall consider two such unsettled matters.
Unfortunately, this claim is not universally supported. Some builders of closely-spaced quads claim that they obtain the performance predicted by calculations, models, and other quad users. Hence, we have an open question as to the disparity of experiences.
One important advantage of more widely spaced quads can be demonstrated by examining the azimuth patterns across a ham band, in this case, the first MHz of 10 meters.
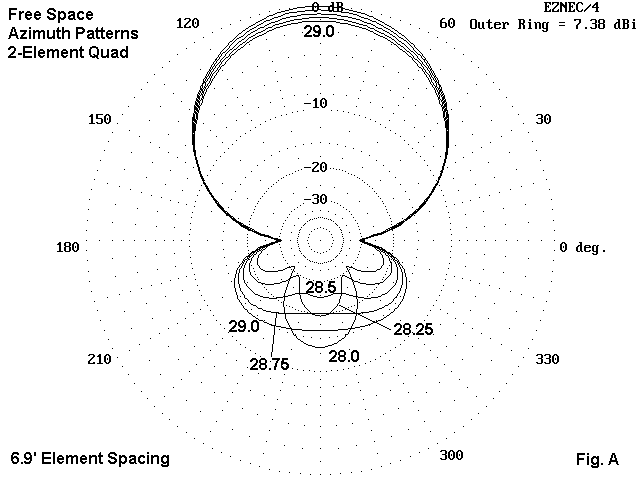
In Fig. A, we have patterns every 250 kHz across the lower end of 10 meters for the most widely-spaced quad in our collection, the one with 0.2 wl element spacing. This azimuth pattern exercise can be compared with Fig. 2 in the preceding episode. The rear quadrants of the patterns in Fig. A show far less variation than those of the more closely spaced (0.145 wl) version in Fig. 2. The lesser variation is indicative of the fact that minor variations of structure--whether loop length or spacing--create smaller performance changes when the elements are more widely spaced.
Another way to approach the same point is to examine the source impedance of various quad designs across the operating pass band. The following table lists source impedances for three models: the most closely spaced version (0.125 wl), a middling version (0.16 wl) and a widely paced version (0.2 wl). Only three checkpoints are given: 28.0, 28.5, and 29.0 MHz.
                         Source Impedance:  R +/- j X Ohms
Frequency              0.125 wl            0.16 wl             0.2 wl
28.0                 52.6 - j 64.9       86.0 - j 47.3      127.4 - j 29.7
28.5                101.7 - j  0.9      134.7 - j  2.1      165.7 + j  3.3
29.0                147.4 + j 30.4      167.5 + j 20.3      184.2 + j 17.5
     Delta R             94.9 Ohms           81.5 Ohms           56.8 Ohms
     Delta X             95.3 Ohms           67.6 Ohms           47.2 Ohms
Compared to the values for the narrowest spacing, the resistance range for the widest spacing is 40% smaller and the reactance range 50% smaller. Since none of the values obtained for the feedpoint impedance of the 2- element quad is a direct match for the usual 50-Ohm coax feedline, some sort of matching system will be required. Not only will the lesser resistance and reactance excursions make it easier to provide a band-edge- to-band-edge match within a 2:1 SWR range, but as well they will in most system improve efficiency (or, to say the same thing, reduce losses).
Replicating the performance of a model with an actual antenna requires more than just obtaining an SWR curve that is similar to that predicted by a model. The parameters of gain and front-to-back ratio must also be replicated by adjustment of the antenna dimensions. Normally, the front- to-back ratio is easier to determine than gain. A helper station or a signal source at least 10 wl distant from the antenna is usually sufficient to find the frequency at which signals from the antenna rear are minimum.
Adjustment of a full-size reflector requires alteration of the wire length of a loop that is often already soldered closed. However, two alternative schemes often permit reflector adjustment.
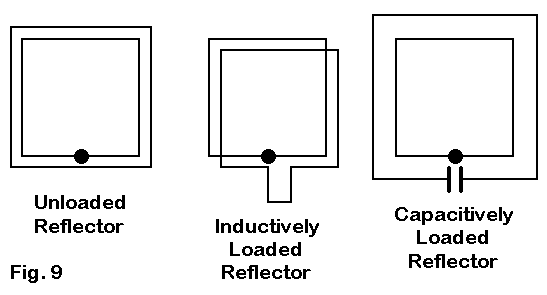
As shown in Fig. 9, we may use either inductive or capacitive loading on the reflector. In many past designs, inductive loading has been used because it permits the reflector to be the same size as the driven loop-- about 5% shorter than a full size reflector at the closest spacing. The inductive reactance required to electrically lengthen the reflector to full size can be provided by either an inductor or a length of shorted transmission line. If we choose to use capacitive loading, we must enlarge the reflector and electrically shorten it with capacitive reactance. Ordinarily, a variable capacitor is used to find the correct value and then is replaced by a fixed capacitor.
Apart from the matter of loop size, we can wonder if one loading system has an advantage over the other. Here modeling can suggest some answers. I created three alternative models to the 0.125 wl element spacing version of the full size quad. There are two inductively loaded quads with identical loops sizes, one using an inductor with a Q of 300 and the other using a shorted transmission line. Since the inductively loaded models shortened the reflector loop length by 5%, the loop for the capacitively loaded model increase the reflector loop length by a like amount. The table shows the dimensions of the 4 antennas, each of which uses a 4.31' (0.125 wl) spacing between elements.
Load      L Driver  C Driver  L Refl.   C Refl.   Refl. React.
Type       feet      feet      feet      feet      Ohms
None       8.66     34.64      9.16     36.64      ---
Coil       8.66     34.64      8.66     34.64      140
TL         8.66     34.64      8.66     34.64      140
Capac.     8.66     34.64      9.68     38.72      150
A coil with a Q of 300 and a reactance of 140 Ohms will have at the design frequency of 28.5 MHz a series resistance of about 0.47 Ohms and an inductance of 0.78 microH. To achieve the same reactance with a 600-Ohm, velocity factor 1.0 transmission line requires a shorted section about 1.26' long. A capacitive reactance of 150 Ohms at 28.5 MHz requires about 37.3 pF.
All of these values can be modeled in NEC and all but the transmission line in MININEC using the facilities for mathematical loads. Since the loads are installed at the center point of the reflector lower element, the likelihood of error due to a differential between a mathematical load and a physically modeled load is minimized. Comparing the performance reports across the first MHz of 10 meters for all four models provides some interesting results.
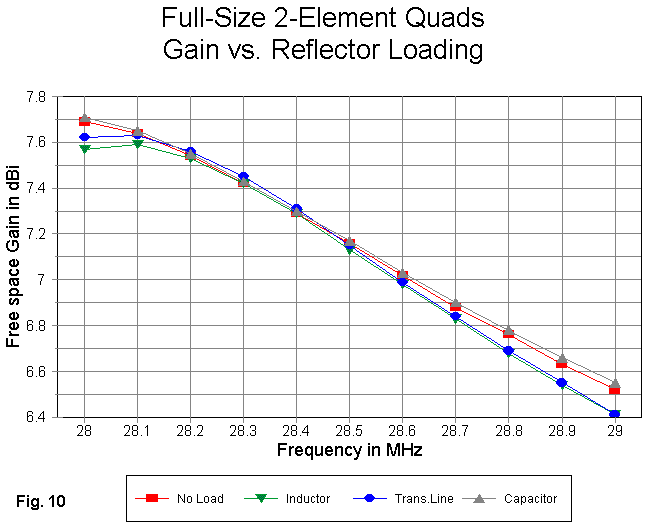
Operationally, the gain of the 4 quad models is insignificantly different, as shown in Fig. 10. However, some emergent trends are apparent. Both forms of inductive loading narrow the pass band of the gain curve so that the gain peak is no longer lower in frequency than 28 MHz. There is a noticeably more rapid decrease in gain at the high end of the pass band as well. The gain curve for the capacitively loaded model is insufficiently different from that of the unloaded model to suggest that capacitive loading provides a shallower curve of gain decrease across the band. However, the hint of difference may lead some modelers to experiment with even larger reflectors and heavier capacitive-reactance loading.
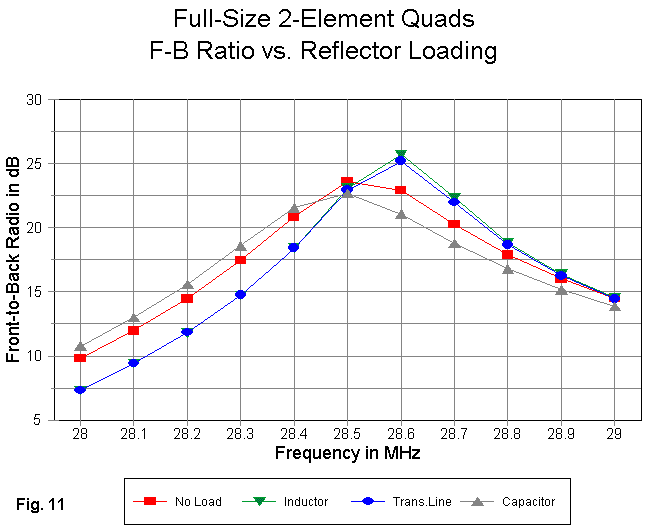
In contrast to their gain curve, the inductively loaded models provide a higher peak front-to-back ratio than either the unloaded or the capacitively loaded model, as revealed in Fig. 11. The curve for the capacitively loaded model is distinctly shallower than even that of the unloaded model. All of the models show about the same front-to-back ratio at the upper end of the pass band, which makes evident the lower front-to- back ratio at the lower end of the band provided by the two inductively loaded models. As with gain, the inductively loaded models show a narrower pass band for a given performance level, while the larger, capacitively loaded reflector shows a wider pass band for a given level of performance.
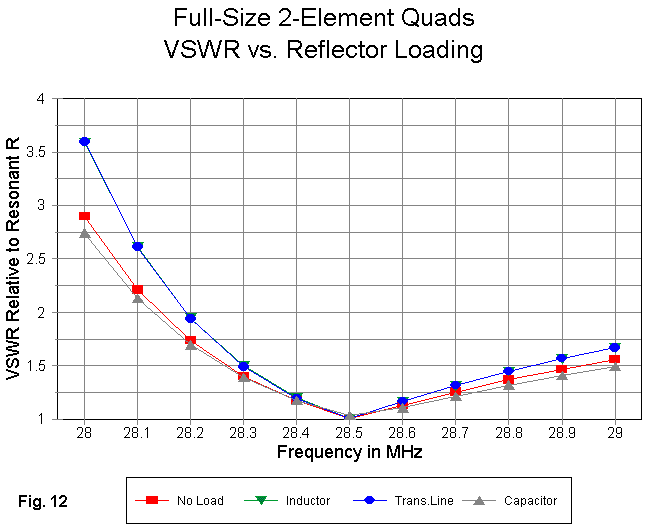
The SWR (relative to the impedance at resonance) performance of the models appears in Fig. 12. note that the 600-Ohm shorted stub provides an SWR curve that is indistinguishable from that for a coil with a Q of 300. Both curves are significantly sharper than the curves for the unloaded model and the capacitively loaded model. Consistent with the results for gain and for the front-to-back ratio, the capacitively loaded model shows the broadest curve.
The SWR curves for all four models can be brought within a 2:1 SWR range by lowering the driver resonant frequency. However, the drivers for the inductively loaded models will have to be resonated at a noticeably lower frequency than those of the unloaded and capacitively loaded models in order to achieve a 2:1 SWR operating bandwidth.
For reference, here are the reported performance figures for the design center frequency (28.5 MHz) for the four models.
Load           Free Space     Front-to-Back       Feedpoint Impedance
Type           Gain dBi       Ratio dB            R +/- jX Ohms
None            7.16           23.6                102 - j 1
Coil            7.13           23.1                 96 + j 0
Trans. Line     7.15           22.9                 96 + j 1
Capacitor       7.17           22.7                106 - j 4
Both the capacitively loaded and the transmission-line stub loaded models invoke no losses in the modeled load. Hence, their gains are about the same as the unloaded model. The reflector coil has a finite Q (300) and hence shows the effect of the loss. Inductive loading, with its smaller reflector loop size, also lowers the resonant impedance of the model. In contrast, capacitive loading and the larger reflector loop increase the resonant impedance of the array. The variance from the impedance of the unloaded full-size quad is not great, but it indicates another trend to be cataloged for possible later use.
Reflector loading provides a convenient method of optimizing the front-to- back performance of the quad beam. Of the two inductive methods, there is little to choose between using a coil and using a shorted transmission line stub. However, capacitive loading provides greater advantages than either form of adding inductive reactance, but at the cost of a physically larger reflector loop. Whether or not the larger loop is mechanically feasible, modeling cannot say.
However, modeling cannot provide a definitive answer to the typical quad vs. Yagi dispute. Whether there are factors beyond gain, front-to-back ratio, and SWR bandwidth that give one or the other antenna type the edge exceeds the ability of models to determine. Hence, we shall confine modeling analysis to what it can do.
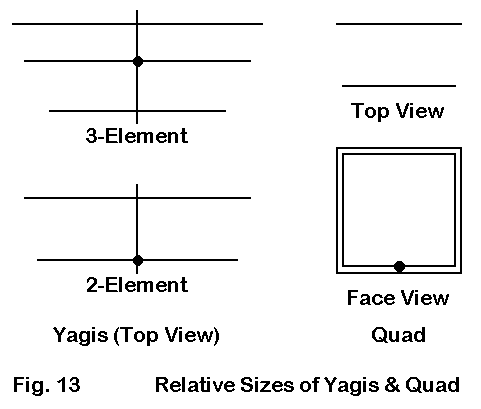
Fig. 13 shows the outlines of a short-boom 3-element Yagi, a typical driver-reflector 2-element Yagi, and one of the 2-element quad models--the version using 5' spacing and a driver resonated at about 28.35 MHz to bring the SWR curve within 2:1 limits across the first MHz of 10 meters. The dimensions of the three antennas are as follows:
Quad
Spacing   Spacing   L Driver  C Driver  L Reflector    C Reflector
 WL        feet      feet      feet      feet           feet
0.145      5.02      8.76     35.04      9.19          36.77

2-Element Yagi
Spacing   Spacing        L Driver       L Reflector
 WL        feet           feet           feet
0.125     4.33           16.06          17.33

3-Element Yagi
Ref-DE    DE-Dir    Total     L Reflector    L-Driver       L-Director
Sp-feet   Sp-feet    feet      feet           feet           feet
 2.5       5.0       7.5       17.66         16.63          15.44
The footprints of these 3 antenna models are clear in Fig. 13. However, the "footprint" figure of speech also reminds us that while the Yagis are flat sandals, the quad is a boot with as much height as width.
For reference, here are EZNEC model descriptions of the two Yagis used for this set of comparisons. The models are so simple that translation into any other program format should be easy.
2-el Yagi 1/8 wl sp 10m                        Frequency = 28.4  MHz.

Wire Loss: Aluminum -- Resistivity = 4E-08 ohm-m, Rel. Perm. = 1

              --------------- WIRES ---------------

Wire Conn.--- End 1 (x,y,z : ft)  Conn.--- End 2 (x,y,z : ft)  Dia(in) Segs

1         -8.667,  0.000,  0.000         8.667,  0.000,  0.000 5.00E-01  31
2         -8.033,  4.333,  0.000         8.033,  4.333,  0.000 5.00E-01  31

              -------------- SOURCES --------------

Source    Wire      Wire #/Pct From End 1    Ampl.(V, A)  Phase(Deg.)  Type
          Seg.     Actual      (Specified)

1          16     2 / 50.00   (  2 / 50.00)      1.000       0.000       I

No loads specified
No transmission lines specified
Ground type is Free Space

3-el Yagi short-boom 10m                        Frequency = 28.5  MHz.

Wire Loss: Aluminum -- Resistivity = 4E-08 ohm-m, Rel. Perm. = 1

              --------------- WIRES ---------------

Wire Conn.--- End 1 (x,y,z : ft)  Conn.--- End 2 (x,y,z : ft)  Dia(in) Segs

1         -8.828,  0.000,  0.000         8.828,  0.000,  0.000 5.00E-01  31
2         -8.317,  3.000,  0.000         8.317,  3.000,  0.000 5.00E-01  31
3         -7.721,  7.500,  0.000         7.721,  7.500,  0.000 5.00E-01  31

              -------------- SOURCES --------------

Source    Wire      Wire #/Pct From End 1    Ampl.(V, A)  Phase(Deg.)  Type
          Seg.     Actual      (Specified)

1          16     2 / 50.00   (  2 / 50.00)      1.000       0.000       I

No loads specified
No transmission lines specified
Ground type is Free Space
Since the Yagis are for study purposes only, their elements are a uniform 0.5" diameter and are aluminum. Slightly different elements lengths would be required for actual Yagis using an element diameter tapering schedule. The quad remains #14 AWG copper wire. The 3-element Yagi is adapted from a K6STI design in the YO collection. I have intentionally used a short boom version that is competitive in gain with the 2-element quad. 3-element Yagis with booms in the vicinity of 11.5 to 12 feet would show about an additional 1 dB forward gain.
It is possible to make parallel frequency sweeps with the three designs and compare the performance potential of the three antennas.
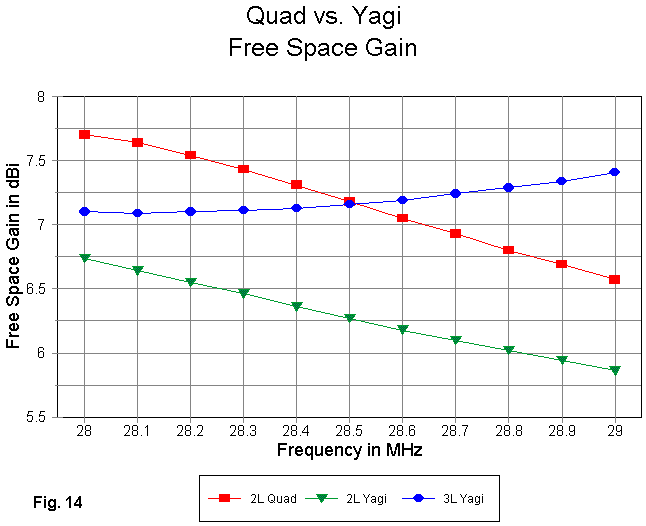
The free-space forward gain of all three antennas appears in Fig. 14. At the design center frequency (28.5 MHz), the 3-element Yagi and the 2- element quad have almost identical gain figures. However, the gain vs. frequency characteristics of the quad and the larger Yagi are opposing, so that as the gain of one increases, the gain of the other decreases. The 3- element Yagi shows a rather small gain change across the pass band, while the change for the quad is about 0.8 dB.
The gain of the 2-element Yagi is significantly lower than that of the 2- element quad--almost a full dB across the band. Because the quad and the 2-element Yagi are both driver-reflector designs, their gain curves parallel. A driver-director 2-element Yagi gain curve would parallel that of the 3-element Yagi, but the operating bandwidth would be much narrower.
It may be useful to notice one more property displayed by the gain curves. By judicious selection of data points, one can develop some misleading claims about antennas. for example, if we focus only on the gain at 28 MHz, then the gain differential between the 2-element and 3-element Yagis is only about a third of a dB--hardly a sufficient reason to add the third element. At 29 MHz, the differential is about 1.6 dB, making the 2-element Yagi seem hardly worthwhile in the comparison. As always, the message is the same: do not be satisfied with data points. Instead, demand the curves.
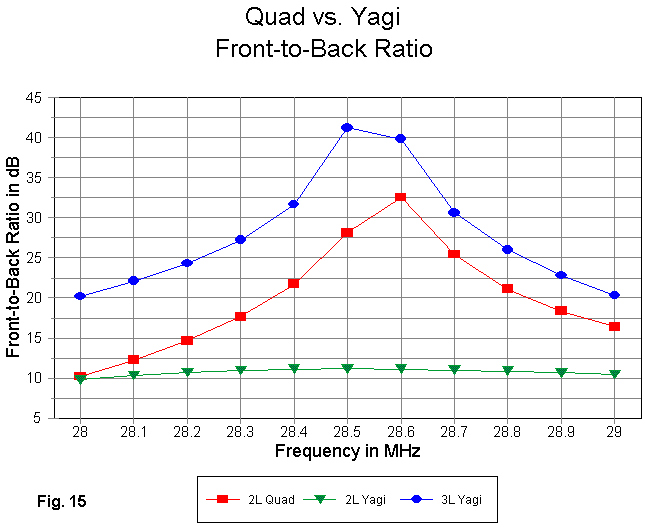
If there is one place where the 2-element driver-reflector Yagi suffers, it is in the category of the front-to-back ratio, as Fig. 15 reveals. The flat curve between 10 and 11 dB would be reflected in any defined front-to-rear performance evaluation. This curve does not mean that the 2-element Yagi is not useful. In fact, it can be an advantage to some types of net and contest operations where total rejection of signals from the rear quadrants is not a useful property. Again, a 2-element driver-director design would show a higher front-to-back ratio, but would be usable only over a much narrower bandwidth.
However, both the quad and the 3-element Yagi show superior overall performance. The curves are remarkably parallel to each other. At the lower end of the band, the Yagi shows almost 10 dB greater rear rejection, with a lesser advantage in the upper part of the pass band. All-in-all, the quad is clearly intermediate to the Yagis in front-to-back performance.
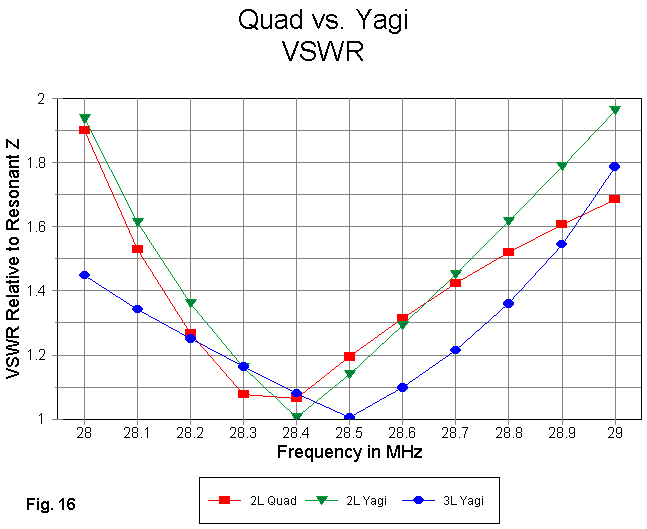
Fig. 16 shows that all three antennas, relative to their resonant impedances, are capable of a 2:1 SWR across the pass band of concern here. Of more interest are contrasting patterns of the SWR curves. The steep quad curve below resonance (28.35 MHz in the example) becomes a very shallow curve above resonance. The 2-element Yagi--resonated at 28.4 MHz to achieve the 2:1 SWR fit--reflects the low-end steep curve of the quad, but is no where near as shallow above resonance. In sharpest contrast stands the 3-element Yagi curve: shallower below resonance and steeper above resonance. Built into these curves are some lessons about the effects of directors on Yagi design.
The true business at hand is placing the performance potential of the 2-element full-size quad beam among its normal design competitors. As expected, it comes out somewhere in the middle.
However, the competitors on this modeling comparison are full-size monoband Yagis. Monoband quads in amateur use are rarely the norm. Where they are used, the operator often wants minimal size and sometimes resorts to techniques of shrinking the full-size quad. Therefore we shall have to look at shrunken quads and their potential performance. Keeping the Yagi figures and the full-size quad figures in mind will be useful in evaluating the performance potential of scrunched and squashed quads.
The other major use of 2-element quads is in multi-band version covering 3 to 5 amateur bands. We shall also have to examine some models of these types of antennas.
But first, a small digression.
With respect to performance, neither shape has an edge. In my collection of quad models, I have found no difference in the performance figures for either shape. To illustrate, let us look at the model description for the diamond equivalent of the 0.125 wl spaced 2-element quad. The model is simple enough not to require replication in other formats.
2el quad dia. 6.12/6.48/4.31sp               Frequency = 28.5  MHz.

Wire Loss: Copper -- Resistivity = 1.74E-08 ohm-m, Rel. Perm. = 1

              --------------- WIRES ---------------

Wire Conn.--- End 1 (x,y,z : ft)  Conn.--- End 2 (x,y,z : ft)  Dia(in) Segs

1   W4E2   6.123,  0.000,  0.000  W2E1   0.000,  0.000,  6.123    # 14    7
2   W1E2   0.000,  0.000,  6.123  W3E1  -6.123,  0.000,  0.000    # 14    7
3   W2E2  -6.123,  0.000,  0.000  W4E1   0.000,  0.000, -6.123    # 14    7
4   W3E2   0.000,  0.000, -6.123  W1E1   6.123,  0.000,  0.000    # 14    7
5   W8E2   6.476, -4.310,  0.000  W6E1   0.000, -4.310,  6.476    # 14    7
6   W5E2   0.000, -4.310,  6.476  W7E1  -6.476, -4.310,  0.000    # 14    7
7   W6E2  -6.476, -4.310,  0.000  W8E1   0.000, -4.310, -6.476    # 14    7
8   W7E2   0.000, -4.310, -6.476  W5E1   6.476, -4.310,  0.000    # 14    7

              -------------- SOURCES --------------

Source    Wire      Wire #/Pct From End 1    Ampl.(V, A)  Phase(Deg.)  Type
          Seg.     Actual      (Specified)

1           7     3 /100.00   (  3 /100.00)      1.000       0.000      SV

No loads specified
No transmission lines specified
Ground type is Free Space
The model is fed in one of the two most commonly used ways--with a split feed, one source being placed on each of the segments adjacent to the lowest corner.

As shown in Fig. 17, one can also create a special wire of at least 3 segments having equal length with the single source on the center segment. This method tends to shorten the overall loop size by a tiny amount--enough to show up in the performance report decimal columns, but not enough to affect building plans or performance curves.
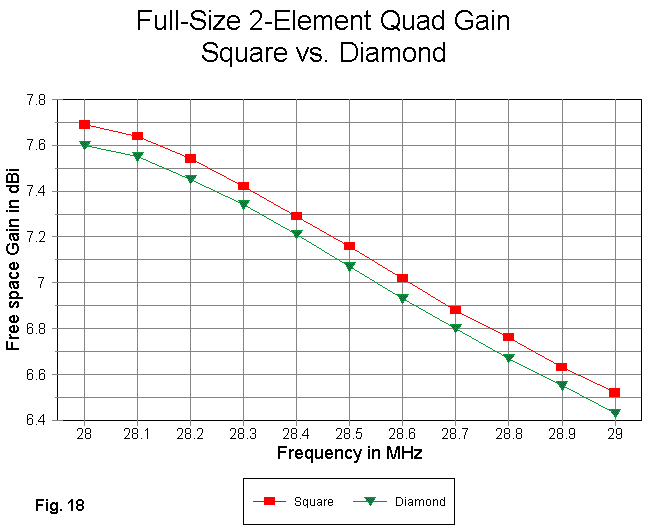
Fig. 18 shows that the gain is systematically within 0.09 dB between the two shapes for the entire first MHz of 10 meters.
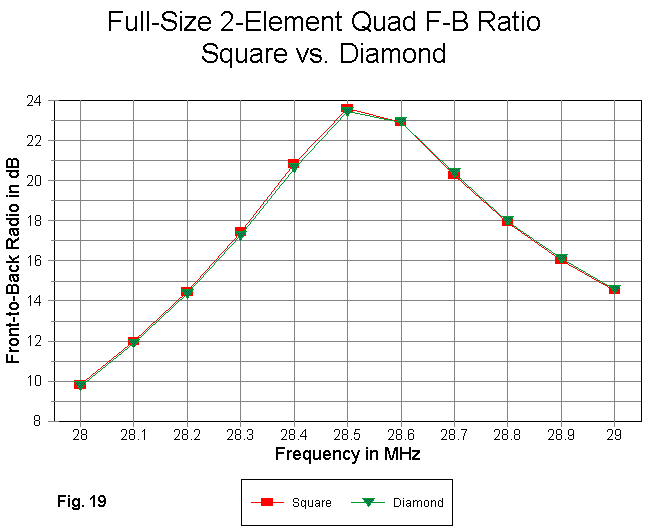
The front-to-back ratio for the two models is even closer, as most of the reference markers obscure each other in Fig. 19.
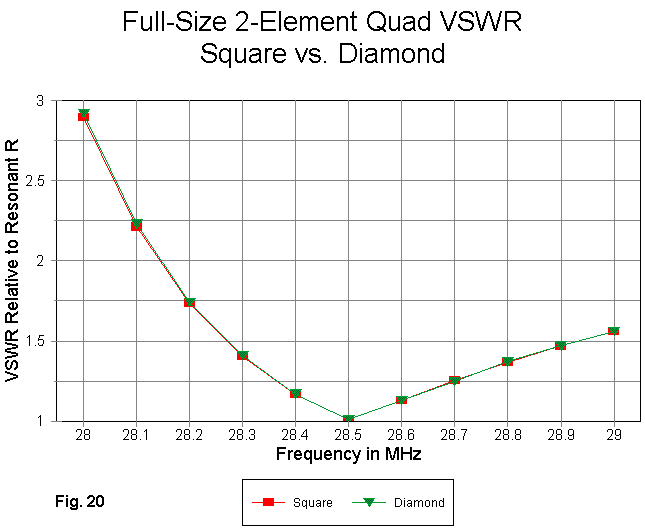
Although the diamond shaped quad shows a resonant impedance abut 4 Ohms high then the square version, Fig. 20 shows that the two SWR curves overlap each other almost perfectly.
One might view the graphing of these overlapping curves as excessive. However, given the degree to which I have argued for showing curves to verify modeling claims about performance, they are simply a matter of practicing what I preach.
With the square-diamond comparison complete, we may now turn to another variation: the rectangle. However arranged, the square is not the quad form capable of the highest gain. A vertical rectangle can increase gain significantly.
Consider 2-element monoband quads with the following dimensions, where an entry of the order 6.9/11 means 6.9' horizontally and 11' vertically. These models happen to use #12 copper wire, since they occurred as part of a separate modeling experiment.
Spacing   Spacing   L Driver  C Driver  L Reflector    C Reflector
 WL        feet      feet      feet      feet           feet
Rectangular
0.200      6.91     6.8/11.0  35.60     7.4/11.0       36.80
0.160      5.50     6.9/11.0  35.80     7.3/11.0       36.60
Square
0.200      6.91      8.86     35.44      9.32          37.28
For reference, here is an EZNEC model description of the wide-spaced rectangular 2-element quad array.
2-el. rect. quad                               Frequency = 28.5  MHz.

Wire Loss: Copper -- Resistivity = 1.74E-08 ohm-m, Rel. Perm. = 1

              --------------- WIRES ---------------

Wire Conn.--- End 1 (x,y,z : ft)  Conn.--- End 2 (x,y,z : ft)  Dia(in) Segs

1   W4E2  -3.400,  0.000, -5.500  W2E1   3.400,  0.000, -5.500    # 12   11
2   W1E2   3.400,  0.000, -5.500  W3E1   3.400,  0.000,  5.500    # 12   15
3   W2E2   3.400,  0.000,  5.500  W4E1  -3.400,  0.000,  5.500    # 12   11
4   W3E2  -3.400,  0.000,  5.500  W1E1  -3.400,  0.000, -5.500    # 12   15
5   W8E2  -3.700, -6.900, -5.500  W6E1   3.700, -6.900, -5.500    # 12   11
6   W5E2   3.700, -6.900, -5.500  W7E1   3.700, -6.900,  5.500    # 12   15
7   W6E2   3.700, -6.900,  5.500  W8E1  -3.700, -6.900,  5.500    # 12   11
8   W7E2  -3.700, -6.900,  5.500  W5E1  -3.700, -6.900, -5.500    # 12   15

              -------------- SOURCES --------------

Source    Wire      Wire #/Pct From End 1    Ampl.(V, A)  Phase(Deg.)  Type
          Seg.     Actual      (Specified)

1           6     1 / 50.00   (  1 / 50.00)      1.000       0.000       I
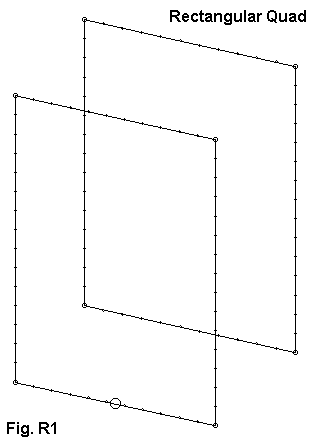
Fig. R1 provides a sketch of the rectangular quad outline. The rectangles in the models shown here have not been shape-optimized for maximum gain, so further improvements might well be made to the mid-band performance shown here for reference.
Antenna        Free Space     Front-to-Back       Feedpoint Impedance
               Gain dBi       Ratio dB            R +/- jX Ohms
Rect: wide sp   7.42           26.7                109 - j 3
Rect: close sp  7.61           19.8                 94 + j39
Square          6.85           24.0                167 + j 8
Both the close-spaced rectangle and the square were resonated lower in the band (28.3 to 28.35 MHz) to establish an SWR curve with close to equal values at the band edges. (Note: for comparison with the #12 square quad in the table above, the #14 copper version of the square quad, shown in the last episode, had a free space gain of 6.81 dBi, a front-to-back ratio of 23.8 dB, and a source impedance of 166 Ohms.)
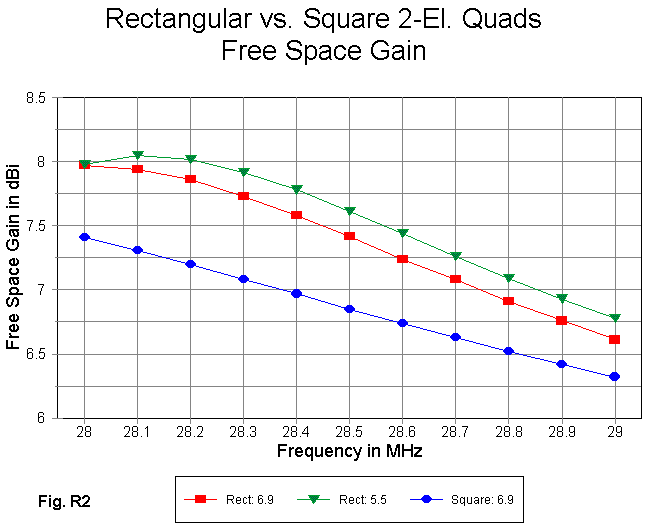
The gain curves for the three models, shown if Fig. R2, demonstrate the higher gain possible with a 2-element parasitic rectangular beam. At midband, the wide-spaced rectangle shows a 0.5 dB advantage over the square model, and further improvement might be possible by optimizing the rectangle's shape for maximum gain. The ratio of horizontal to vertical dimension will vary with frequency, so optimization would be required for each band on which such a scheme might be used.
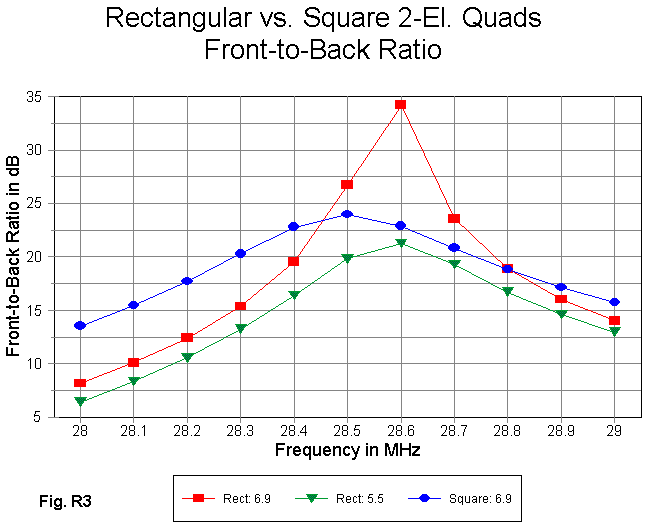
Although the rectangle provides higher gain, it yields lower front-to-back ratios on average than the square model, as revealed in Fig. R3. Despite the peak in the wide spaced rectangular model, the overall performance is less satisfactory than the square, with the lower end of the band suffering most. some improvement can likely be effected by sliding the front-to-back maximum lower in frequency.
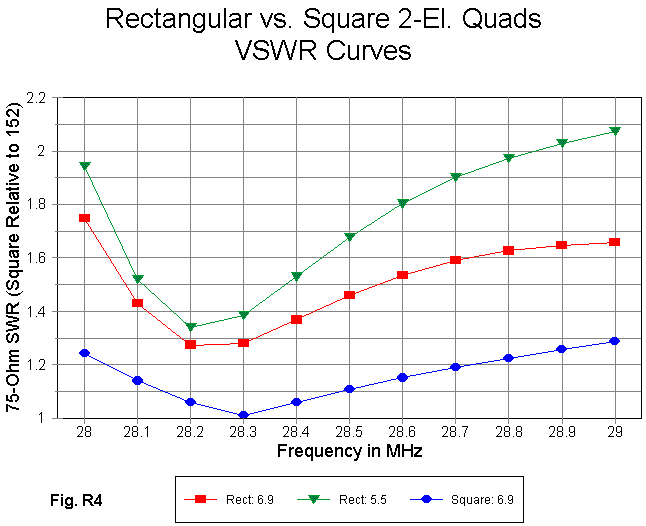
Fig. R4 provides some SWR curves. The curve for the square is referenced to the resonant impedance of the antenna (about 152 Ohms) simply to show the flatness of the curve. Without provision for matching, the two rectangular quads both achieve usable 75-Ohm SWR curves, with the wide-spaced model slightly better. As one make a horizontally polarized loop more vertically rectangular, the source impedance decreases. The decrease also shows up in the source impedance for rectangular quad beams.
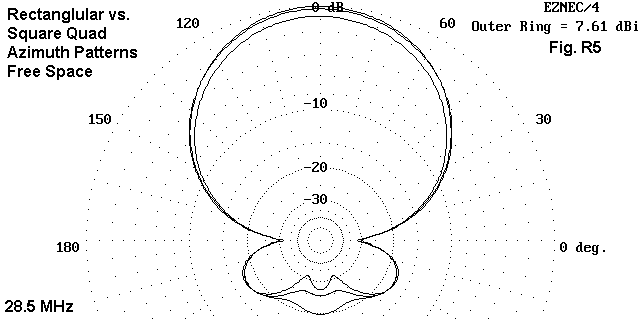
Comparative mid-band (28.5 MHz) free space azimuth patterns appear in Fig. R5. The increased gain and decreased front-to-back ratio are quite clear on the pattern overlays.
The point of this particular modeling exercise is to demonstrate that the square quad is simply not the ultimate in quad gain, no matter the spacing or loop size. The rectangular quad is capable of significantly higher gain. Of course, the square has some structural advantages which may override use of a higher-gain configuration. But, then, almost all antennas represent a compromise among all of the factors and specifications that go into their design and construction. The quad is no exception.
Updated 2-22-99. © L. B. Cebik, W4RNL. Data may be used for personal
purposes, but may not be reproduced for publication in print or any other medium
without permission of the author.