
 Some Model Quads:
Models of full size 2-element quad beams are not difficult to make or to optimize for some desired set of maximum performance figures at a design frequency. Almost all 2-element quads use the driver-reflector configuration to maximize the operating bandwidth (relative to driver- director parasitic beams). Since the quad offers a bit of extra gain and a very good front-to-back ratio relative to a 2-element driver-reflector Yagi with the same element spacing, operating bandwidth is the next parameter on the normal list of specifications, and the driver-reflector type of parasitic quad beam offers this feature as well.
There are three dimensions to any quad:
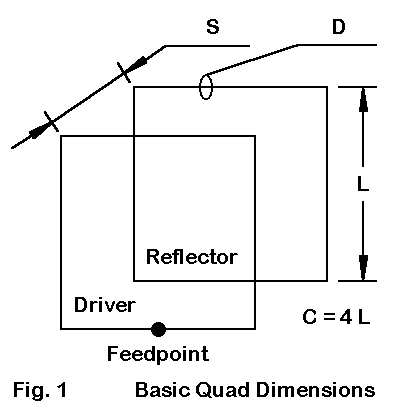
As Fig. 1 demonstrates, the first dimension is the wire length or loop size of each element. We can specify this in terms of the length of a side, since most quads employ a square configuration for ease of mechanical construction. Hence, the circumference of the loop is simply 4 times the length of a side. As noted in the introduction, the length of half the side can be important in setting up coordinates for a model.
As our first exercise below will demonstrate, element spacing will be extremely important to 2-element quad design models. The closer the spacing, the smaller the requisite loops sizes and the lower the source impedance. Since the 2-element quad has a relatively high (compared to 50 Ohms) source impedance, some designers favor close spacing in the attempt to bring the source impedance into a close match with coax. Whether this is wise we shall see.
The third dimension of a quad is the wire size or diameter. For a given loop resonant frequency, the fatter the wire, the larger the required loop circumference. This factor is directly opposed to what we encounter with linear elements. It applies not only to completely closed geometries, like the quad loop, but to many other nearly closed geometries, where normally linear free element ends are brought into close proximity to other normally free element ends.
Unless otherwise specified, all of the quad models we shall examine will use #14 AWG copper wire. Also, except as noted, the models will be designed for a center frequency of 28.5 MHz. The design center frequency can mean many things, since it does not itself say what parameter or parameters are maximized at this frequency. In general, for 2-element design work, setting the resonant frequency of the driver and the approximate maximum front-to-back ratio for the design frequency is a satisfactory starting point. In any 2-element driver-reflector parasitic array, the gain will describe a descending curve from well below the design center to well above it. Peak gain occurs at a point of virtually useless front-to-back ratio and is attempted only for special purposes. Front-to- back ratio for any design tends to show a peak that is a useful reference mark. Adjustments may be required if the slope of performance away from the peak is not symmetrical.
Likewise, it is usually safe to begin with the assumption that the VSWR curve relative to the resonant impedance of the antenna will be roughly symmetrical. Hence, setting the resonant point of the antenna under design to the same frequency as the peak in front-to-back performance is a safe start unless previous analyses indicate otherwise. Adjustments in the driver frequency can usually be made later to compensate for any lack of symmetry in the VSWR curve without unduly upsetting the overall antenna performance. (This is not always true of 2-element Yagis, but is generally true of 2-element quads.)
Remember that the basic quad beam is essentially a 4-element array, although we commonly call it a 2-element beam. Each loop is 1 wl long, consisting of two dipoles joined at their ends and spaced relative to their high current regions about 1/4 wl apart. since the spacing is not optimal for achieving maximum gain from two dipoles, we tend to consider the loop a single element with abut 1.9 dB (maximum) gain over the dipole.
Remember also that peak performance figures can be misleading. Very often, the only extended frequency information given about an antenna design is the 2:1 VSWR curve. However, every major performance parameter deserves attention.
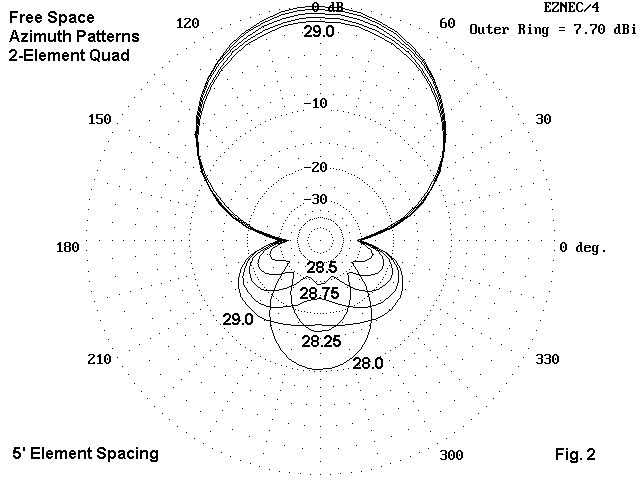
The azimuth patterns in Fig. 2 show significant elements of the performance potential of a monoband quad for 10 meters across the first MHz of the band. If we looked only at the pattern for 28.5 MHz, the design center frequency for this model, we might misunderstand the actual performance. The near-maximum front-to-back pattern might not make clear how that parameter varies across the band. For this model, the low-end front-to- back figure barely exceed 10 dB. Above 28.25 MHz, the front-to-rear performance is at least 15 dB below the maximum forward gain. Only in the vicinity of mid-band is the front-to-rear performance everywhere at least 18 dB below maximum forward gain.
The collection patterns also reveals that there is a significant variation in the forward gain across the band--something over 1 dB between 28 and 29 MHz, with the lowest gain at the highest frequency. The decrease in gain with an increase in frequency is a characteristic typical of parasitic 2- element driver-reflector designs, whether Yagi or quad. Parasitic designs having a director typical show an increase in gain as the frequency increases.
As the spacing increases, placing resonance and the maximum front-to-back ratio at mid-band requires larger loops as the element spacing is increased. The following table shows the essential dimensions for #14 AWG bare copper wire models in this series.
Spacing   Spacing   L Driver  C Driver  L Reflector    C Reflector
 WL        feet      feet      feet      feet           feet
0.125      4.31      8.66     34.64      9.16          36.64
0.145      5.02      8.70     34.80      9.19          36.77
0.160      5.50      8.72     34.88      9.23          36.92
0.174      6.00      8.77     35.06      9.25          37.00
0.200      6.90      8.82     35.28      9.30          37.20
We can get the best idea of performance potential trends by looking at a series of graphs across the first MHz of 10 meters.
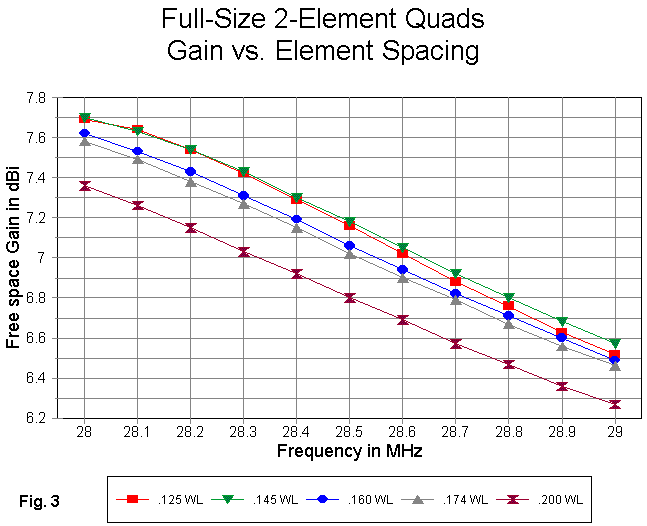
In Fig. 3, we get a good view of the gain curves associated with each of the spacings used. clearly, the widest spacing yields the lowest gain across the band (although gain is not the only consideration in selecting a design). The gain increases as spacing narrows through to the 5' (0.145 wl) spacing. However, as the spacing narrows to 1/8 wl (4.31'), the overall gain curve shows a slight decrease--beginning on a par with the 0.145 wl curve, but decreasing more rapidly as the frequency increases.
Note that the average gain difference between the highest and lowest curves is about 0.4 dB. Operationally, this might be no great loss, but it might be considered to remain above the threshold of significance. In contrast, the differential between any two adjacent curves in the overall plot is truly insignificant. Despite the lack of operational significance, the collection of curves does show the trends in gain--given the design criteria used in constructing the models.
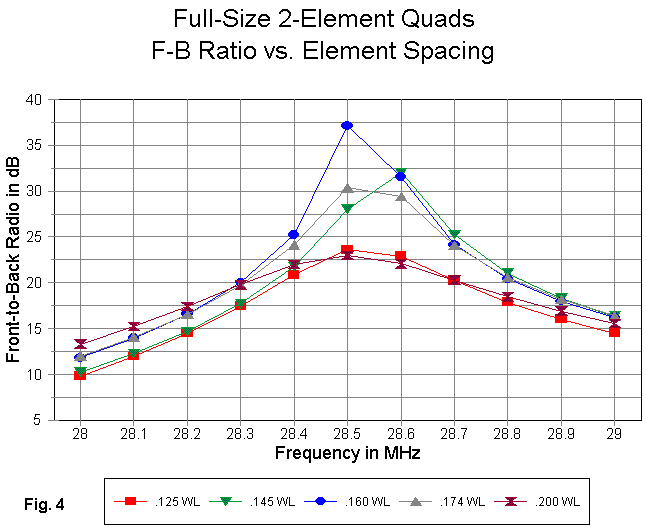
In all cases, as shown in Fig. 4, the maximum 180-degree front-to-back value occurs between 28.5 and 28.6 MHz. Interestingly, both the closest element spacing (0.125 wl) and the widest spacing (0.2 wl) show the lowest peak value. In a curve of this sort, where the checked frequencies are 0.1 MHz apart, it is not possible to say with assurance whether there is no sharp peak or whether it is too sharp to appear.
Nonetheless, it is not the peak, but the overall performance curve that is most important. All of the antennas show a maximum front-to-back ratio well above 20 dB, but equally, all dip well below the 20 dB mark at the band edges. The widest spacings show the best low end performance, while there is no significant difference in performance at the upper band edge.
In general, the quad tends to show a 20 dB 180-degree front-to-back ratio for 500 kHz or less. From the pattern tendencies shown in Fig. 2, the overall front-to-rear performance will be a bit less. Hence, unless one intends to operate over only a very small portion of the band relative to its full span, the deep null that one can obtain at some specific frequency turns out not to accurately indicate the antenna's actual performance potential.
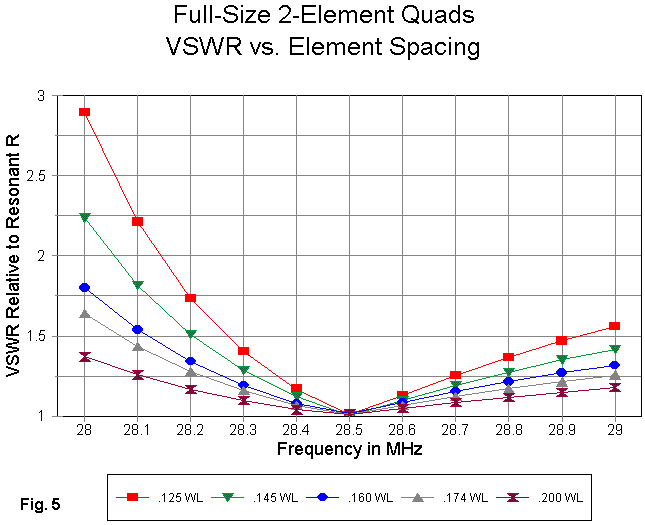
Fig. 5 reveals that the closer the element spacing, the steeper the VSWR curve--and vice versa. Also revealed is the fact that, at any spacing in the range of the models, the curve is much steeper below the resonant frequency than above it.
What the curves do not reveal is the actual antenna impedance at or near resonance. The following table provides modeled performance figures at 28.5 MHz for the five models as a reference against which to read the graphs.
Spacing        Free Space     Front-to-Back       Feedpoint Impedance
 wl/feet       Gain dBi       Ratio dB            R +/- jX Ohms
0.125/4.31      7.16           23.6                102 - j 1
0.145/5.02      7.18           28.0                118 - j 0
0.160/5.50      7.07           40.1                135 - j 2
0.174/6.00      7.02           30.4                146 _ j 2
0.200/6.90      6.81           23.8                166 - j 2
The three widest spacings show SWR values under 2:1 across the first MHz of 10 meters, relative to their resonant impedances. However, over any of the spacings surveyed in these models, the quad shows a very slow rise in SWR above the resonant frequency. We can use this fact to slightly redesign any of the models for a more even SWR performance. We simply reduce the frequency of resonance by enlarging the driven element.
Spacing   Spacing   L Driver  C Driver  L Reflector    C Reflector
 WL        feet      feet      feet      feet           feet
Original
0.145      5.02      8.70     34.80      9.19          36.77
Modified
0.145      5.02      8.76     35.04      9.19          36.77
The change of about 1" per side is sufficient to lower the resonant frequency by about 0.15 MHz. No change is made to the reflector. Let's examine what happens to performance.
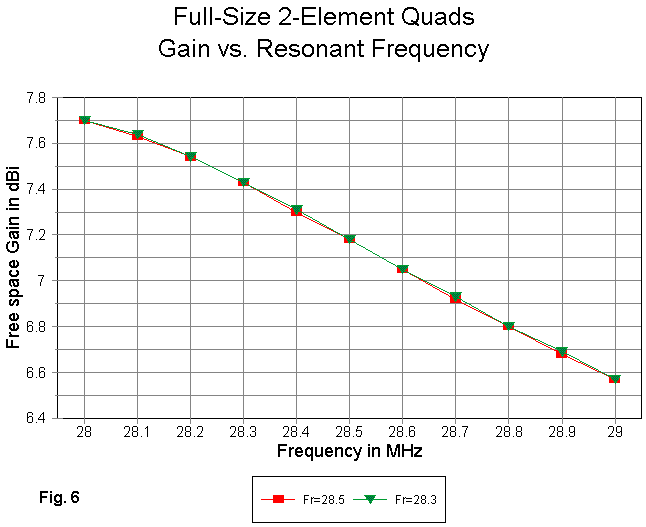
The change of gain, shown in Fig. 6, is wholly without significance.
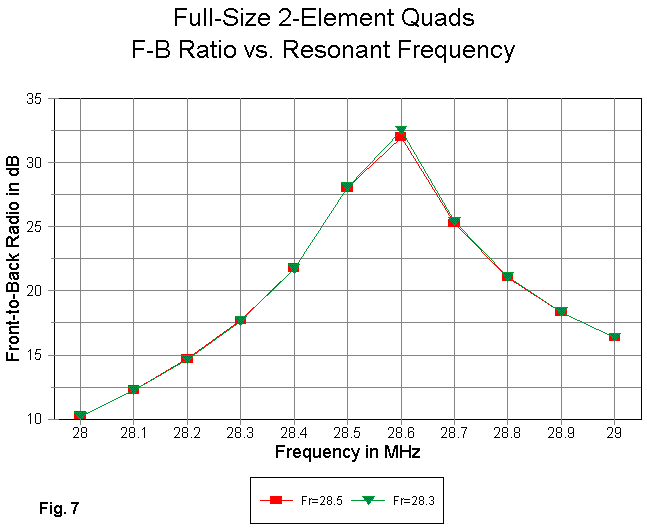
Likewise, as Fig. 7 reveals, there is no change in the front-to-back ratio performance with the modification of the driven element.
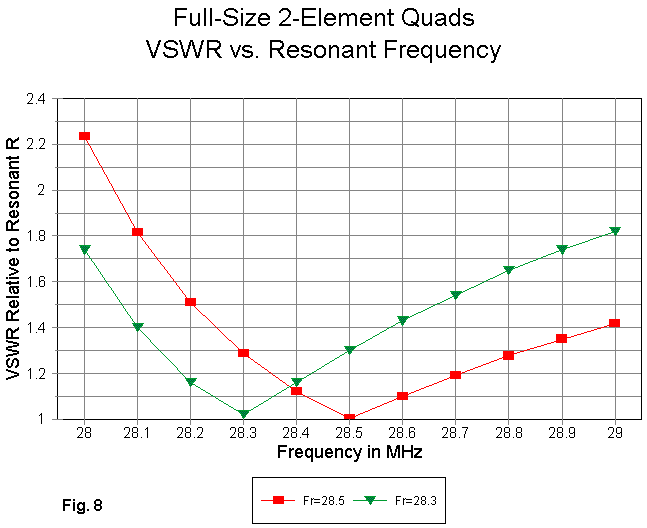
Fig. 8 shows the new SWR curve relative to the old one. The SWR across the first MHz of 10 is now well below 2:1. Changing the resonant frequency to about 28.3 MHz has evened out the values to produce a curve more equal at the ends--without otherwise disturbing the antenna's potential performance.
The exercise shows more than our ability to adjust the SWR curve. It demonstrates the relative immunity of the reflector to moderate changes in the length of the driven element. Hence, the designer has some freedom to place the front-to-back curve and the SWR curve anywhere along the operating band that yields a set of desired operating characteristics.
The models used in this comparative study have used a variable number of segments, range from 7 per side to 21 per side. However, the common 2- element quad converges in NEC with only about 5 segments per side, so differences in gain, front-to-back ratio, and source impedance reports will be minimal.
The following EZNEC model description of the modified quad with 0.145 wl element spacing is typical of all of the models whose dimensions have been shown:
2 el quad 10m 5' sp #14                      Frequency = 28.35  MHz.

Wire Loss: Copper -- Resistivity = 1.74E-08 ohm-m, Rel. Perm. = 1

              --------------- WIRES ---------------

Wire Conn.--- End 1 (x,y,z : ft)  Conn.--- End 2 (x,y,z : ft)  Dia(in) Segs

1   W4E2  -4.380,  0.000, -4.380  W2E1   4.380,  0.000, -4.380    # 14   21
2   W1E2   4.380,  0.000, -4.380  W3E1   4.380,  0.000,  4.380    # 14   21
3   W2E2   4.380,  0.000,  4.380  W4E1  -4.380,  0.000,  4.380    # 14   21
4   W3E2  -4.380,  0.000,  4.380  W1E1  -4.380,  0.000, -4.380    # 14   21
5   W8E2  -4.596, -5.018, -4.596  W6E1   4.596, -5.018, -4.596    # 14   21
6   W5E2   4.596, -5.018, -4.596  W7E1   4.596, -5.018,  4.596    # 14   21
7   W6E2   4.596, -5.018,  4.596  W8E1  -4.596, -5.018,  4.596    # 14   21
8   W7E2  -4.596, -5.018,  4.596  W5E1  -4.596, -5.018, -4.596    # 14   21

              -------------- SOURCES --------------

Source    Wire      Wire #/Pct From End 1    Ampl.(V, A)  Phase(Deg.)  Type
          Seg.     Actual      (Specified)

1          11     1 / 50.00   (  1 / 50.00)      1.000       0.000       V

No loads specified
No transmission lines specified
Ground type is Free Space
In programs having provision for symbolic coordinate entry, three variables would suffice for a full free space description of the model: a value for the driver corners, a value for the reflector corners, and a value for the element spacing. An example, using the AO format is shown below. The axes used for the elements are Y and Z, with the driver coordinate designated "de" and the reflector coordinate "ref." The relative positions of the driver and reflector along the X axis are shown as "dep" and "rep." Otherwise, the model is identical to the EZNEC description shown above.
2-Element Quad
Free Space Symmetric
28.3 MHz
8 copper wires, feet
ref = 4.596
de = 4.38
rp = -5.018
dep = 0
1     dep -de -de  dep de -de  #14
1     dep -de -de  dep -de de  #14
1     dep -de de   dep de de   #14
1     dep de de    dep de -de  #14
1     rp -ref -ref rp ref -ref #14
1     rp -ref -ref rp -ref ref #14
1     rp -ref ref  rp ref ref  #14
1     rp ref ref   rp ref -ref #14
1 Source
Wire 1, center
A more general format is the .NEC ASCII file used by NEC-Win. The same antenna model (with elements in the X and Z axes) in this format appears in the NEC-Win file:
CM 2 el quad 5' sp #14 cu
CE
GW 1 21 -4.38 0 -4.38 4.38 0 -4.38 2.67060367454068E-03
GW 2 21 4.38 0 -4.38 4.38 0 4.38 2.67060367454068E-03
GW 3 21 4.38 0 4.38 -4.38 0 4.38 2.67060367454068E-03
GW 4 21 -4.38 0 4.38 -4.38 0 -4.38 2.67060367454068E-03
GW 5 21 -4.596 -5.018 -4.596 4.596 -5.018 -4.596 2.67060367454068E-03
GW 6 21 4.596 -5.018 -4.596 4.596 -5.018 4.596 2.67060367454068E-03
GW 7 21 4.596 -5.018 4.596 -4.596 -5.018 4.596 2.67060367454068E-03
GW 8 21 -4.596 -5.018 4.596 -4.596 -5.018 -4.596 2.67060367454068E-03
GS 0 0 .3048
GE 0
EX 0 1 11 0 1 0
LD 5 1 1 21 5.8001E7
LD 5 2 1 21 5.8001E7
LD 5 3 1 21 5.8001E7
LD 5 4 1 21 5.8001E7
LD 5 5 1 21 5.8001E7
LD 5 6 1 21 5.8001E7
LD 5 7 1 21 5.8001E7
LD 5 8 1 21 5.8001E7
FR 0 11 0 0 28 .1
RP 0 1 360 1000 90 0 1 1
EN
The wire size (radius) and the material specification (copper) are shown in numerical terms in this file, in the GW and LD lines, respectively. The FR line specified a frequency sweep from 28 to 29 MHz in 0.1 MHz steps.
Both the AO and the .NEC file are usable. Simply download this file, extract the model file portion of the text, and save it as an ASCII file. Use the .ANT extension for the AO file and the .NEC extension for the NEC-Win file. These files may then be modified to create other quad configurations.
Any modeler should know not to expect precisely the same results from multiple programs. At the outset, input and output rounding conventions will alter numeric values very slightly. The selected values for material resistivity may vary slightly from one program to the next. NEC-2 occurs in 16- and 32-bit versions, with very slightly different outputs. The sum of these variations can yield slight numeric differences while using ostensibly the same core.
MININEC differs from NEC in placing pulses at segment junctions. This procedure requires a degree of length tapering in the approach to an angular junction to prevent corner clipping. Depending on the degree of length tapering, MININEC may show a lesser or greater departure from NEC values in the direction of showing result apt to a slightly shorter or higher frequency antenna.
To illustrate the difference, the following table lists results from NEC-Win (NEC-2), EZNEC (NEC-2), and AO (MININEC) for a single model-- the 5' spaced antenna modified for resonance near 28.3 MHz. The values for free space forward gain, 180-degree front-to-back ratio, and source impedance are shown for 28, 28.5, and 29 MHz in an X/Y/Z format (except for source impedance).
Parameter      NEC-Win             EZNEC               AO
Gain in dBi    7.71/7.18/6.58      7.70/7.18/6.57      7.73/7.29/6.68
F-B in dB      10.3/28.4/16.3      10.2/28.2/16.4       8.9/23.2/18.0
Impedance
  28.0          69.4 - j 35.4       69.2 - j 42.5       62.5 - j 45.1
  28.5         120.6 + j 19.6      120.2 + j 12.4      111.0 + j 14.0
  29.0         162.0 + j 45.5      161.5 + j 38.2      154.0 + j 43.0
Operationally--which here would include constructing a 2-element quad of the given design--the differences in these programs are insignificant. The two NEC-2 programs are very close, but not exact. Compared to both NEC-2 result sets, the MININEC output is a bit generous with gain and stingy with front-to-back ratio, with a systematically lower source impedance. However, the variables of construction will in virtually all cases exceed any differences among the numbers in the reports.
If we hold the wire size constant (#14 AWG copper), then the quad does not directly scale to other frequencies without some adjustment of side lengths for both the driver and the reflector. The following table provides model dimensions for 10 meters through 20 meters for similar performance. The discover the amount of adjustment, you may take the ratio of the new frequency to 28.5 MHz and determine the scaled length of the sides to compare with the dimensions used in the actual model. All models use an element spacing of 0.125 wl.
Frequency Spacing   L Driver  C Driver  L Refl.   C Refl.   Segment
 MHz       feet      feet      feet      feet      feet      per side
28.5       4.31      8.66     34.64      9.16     36.64        7
24.94      4.93      9.91     39.62     10.47     41.86        9
21.22      5.79     11.64     46.56     12.26     49.04       11
18.12      6.79     13.62     54.48     14.35     57.40       13
14.17      8.68     17.42     69.68     18.30     73.20       15
The selection of segmentation for each model was determined by my eventual goal of combining them into a single 5-band quad model--a topic which we shall address in a future episode. By taking 1/2 the length of a side, one can get the requisite value of the coordinates for the drivers and the reflectors. The remainder of the model construction is routine.
The modeled performance of the resultant monoband quads is tabulated below:
Frequency      Free Space     Front-to-Back       Feedpoint Impedance
 MHz           Gain dBi       Ratio dB            R +/- jX Ohms
28.5            7.16           23.6                102 - j 1
24.95           7.11           23.9                105 + j 1
21.22           7.18           23.2                 99 + j 2
18.12           7.14           23.7                101 - j 1
14.17           7.15           23.2                 99 + j 0
Despite having the narrowest operating bandwidth of the range of element spacings we have surveyed, all of these 1/8 wl spaced models are amenable to the use of a simple 1/4 wl section of 75-Ohm coax as a matching section for a 50-Ohm main transmission line. However, if the characteristics of one of the wider-spaced 10-meter models is desired, proportional enlargement of the spacing and the side lengths will put one very close to the desired model.
This collection of models should put one well on to the road of quad modeling throughout the upper HF region. However, it does not exhaust the modeling possibilities for simple, full-size 2-element monoband quads. Next time, let's look at a few variations and some questions of comparison.
Updated 2-17-99. © L. B. Cebik, W4RNL. Data may be used for personal
purposes, but may not be reproduced for publication in print or any other medium
without permission of the author.